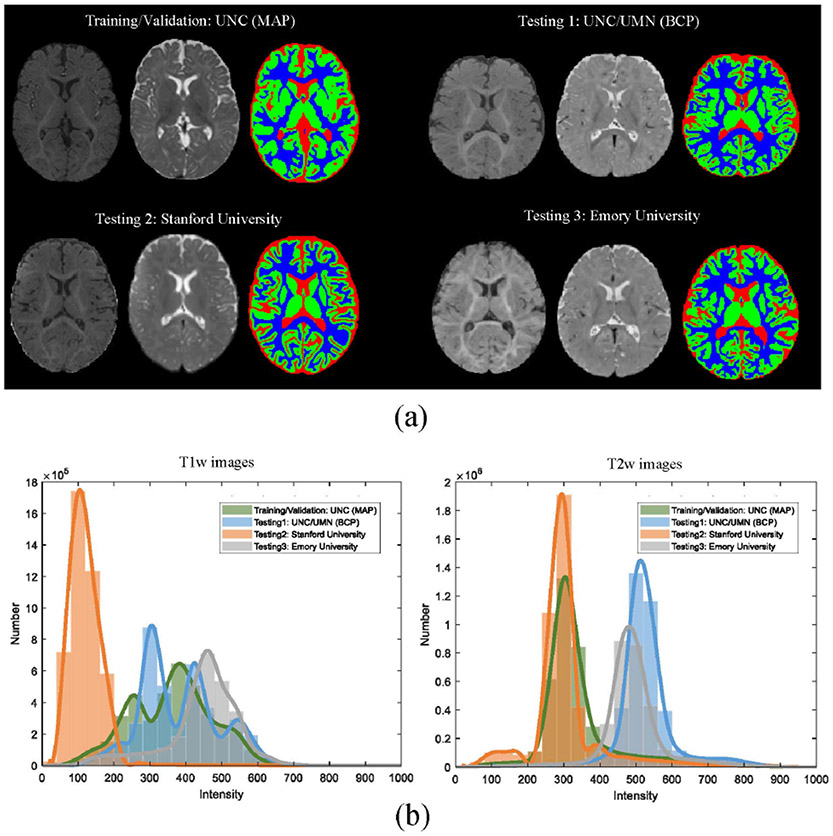
Fig. 2.
T1w and T2w MR images of infant subjects scanned at 6 months of age (isointense phase) from four sites with different imaging protocols/scanners, i.e., UNC (MAP), UNC/UMN (BCP), Stanford University, and Emory University, provided by the iSeg-2019. (a) Intensity images and the corresponding manual segmentations from each site. From left to right: T1w MR image, T2w MR image, and manual segmentation. (b) Average intensity distribution of T1w and T2w images from four sites marked by different colors. Note that the results are from the 8 top-ranked methods on all training/validation and testing datasets in the iSeg-2019 challenge.

