
Figure EV2. Increased BP abundance results from BP self‐amplification.
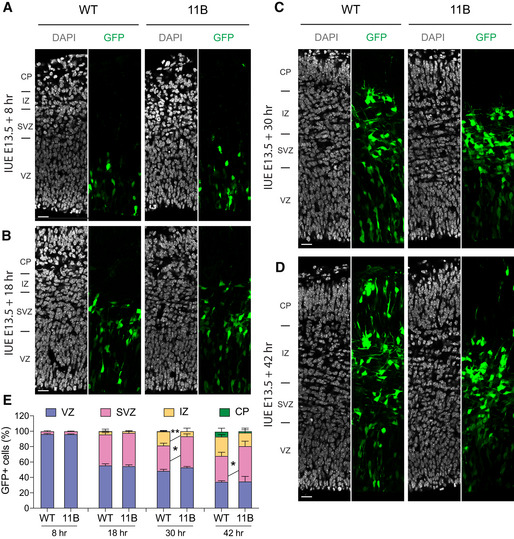
E13.5 wild‐type and 11B mouse neocortex were subjected to IUE with a plasmid encoding GFP, followed by analyses at 8, 18, 30 and 42 h post‐IUE.
-
A–DRepresentative immunofluorescence for GFP (green), combined with DAPI staining (white), of wild‐type (WT) and 11B mouse dorsolateral neocortex rostrally at 8 h (A), 18 h (B), 30 h (C) and 42 h (D) post‐IUE. Images are single optical sections. Scale bars, 20 µm.
-
EDistribution of GFP+ cells across the indicated zones of the neocortical wall, expressed as percentage of the total number of GFP+ cells in a 200 µm‐wide segment of the entire cortical wall, of WT and 11B mouse dorsolateral neocortex, using immunostained cryosections obtained as in (A–D). Data are the mean of 3–5 (WT) and 3–5 (11B) littermate embryos, which were derived from 3 to 4 separate litters at each time point analysed. Error bars indicate SD, two‐way ANOVA, followed by Bonferroni's multiple comparisons test, *P < 0.05, **P < 0.01. P = 0.0231 (30 h, SVZ); P = 0.0086 (30 h, IZ); P = 0.0466 (42 h, SVZ).