. 2021 Jun 8;12(25):8603–8631. doi: 10.1039/d1sc01901e

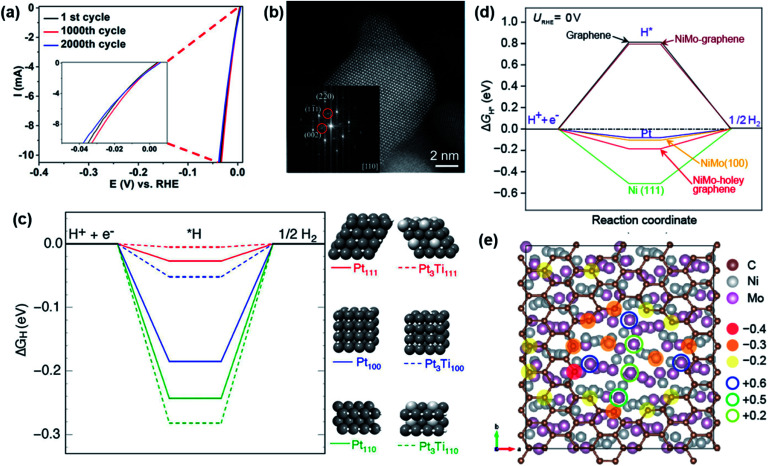
Fig. 9. (a) HER LSV curves before and after the stability tests of intermetallic Pt3Ti. (b) HAADF-STEM image of Pt/Ti3C2Tx-550 (after 1000 cycles in HER) where the inset shows FFT pattern of a Pt3Ti NP. (c) DFT calculations of the free energy diagrams of the hydrogen evolution at the surfaces of Pt (111), Pt3Ti (111), Pt (100), Pt3Ti (100), Pt (110), and Pt3Ti (110). Figures (a–c) are reprinted with permission from ref. 139, copyright 2019, American Chemical Society (d) ΔG profiles calculated by DFT for the NiMo composites, showing the calculated free energy diagram of HER at the equilibrium potential for Pt, Ni(111), NiMo(100) graphene covered and bare as well as graphene covered and with a ∼1 nm hole, and a graphene sheet. (e) Bader charge population analysis of graphene covered NiMo(100) with a ∼1 nm hole. Figures (d and e) are reprinted with permission from ref. 130, copyright 2018, American Chemical Society.

Fig. 9