
Fig. 2.
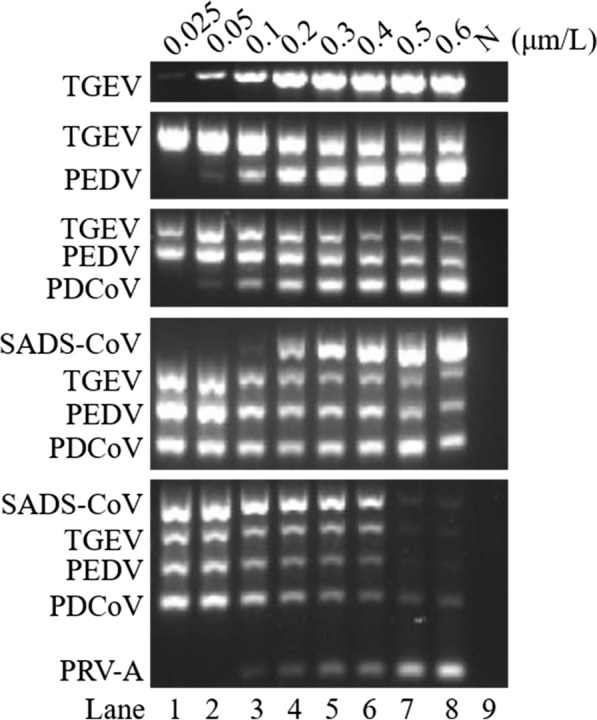
Optimization of the DPO system-based multiplex RT-PCR primer concentration. Lanes 1–8 represent the 8 primer concentrations 0.025 μM, 0.05 μM, 0.1 μM, 0.2 μM, 0.3 μM, 0.4 μM, 0.5 μM, and 0.6 μM; lane 9 represents negative control (N)
Official websites use .gov
A
.gov website belongs to an official
government organization in the United States.
Secure .gov websites use HTTPS
A lock (
) or https:// means you've safely
connected to the .gov website. Share sensitive
information only on official, secure websites.
Optimization of the DPO system-based multiplex RT-PCR primer concentration. Lanes 1–8 represent the 8 primer concentrations 0.025 μM, 0.05 μM, 0.1 μM, 0.2 μM, 0.3 μM, 0.4 μM, 0.5 μM, and 0.6 μM; lane 9 represents negative control (N)