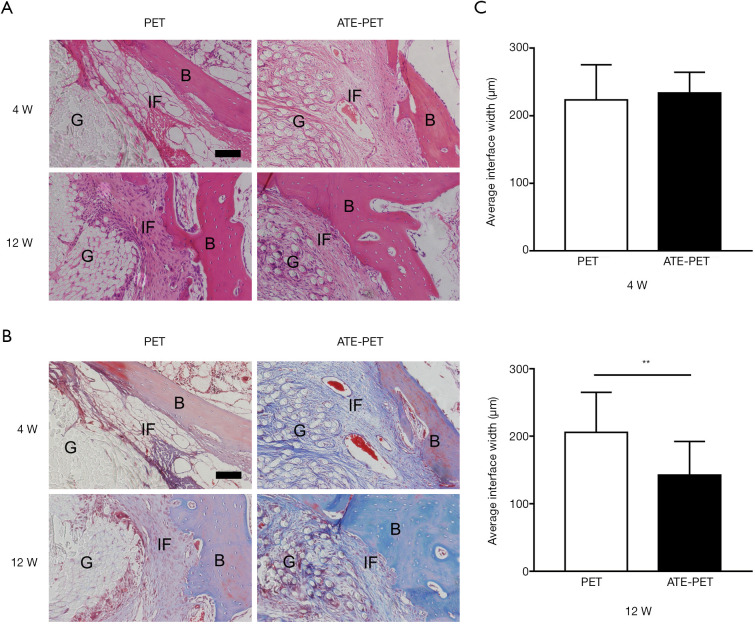
Figure 6.
Representative images of the intraosseous part of graft by (A) H&E staining and (B) Masson Trichrome staining in the PET and ATE-PET groups at 4 and 12 weeks postoperatively; (C) quantification of the interface width between the bone and graft. Bar: 100 µm. **P<0.01. PET, polyethylene terephthalate; ATE, autologous tissue-engineered; IF, interface. B, bone, G, graft.

