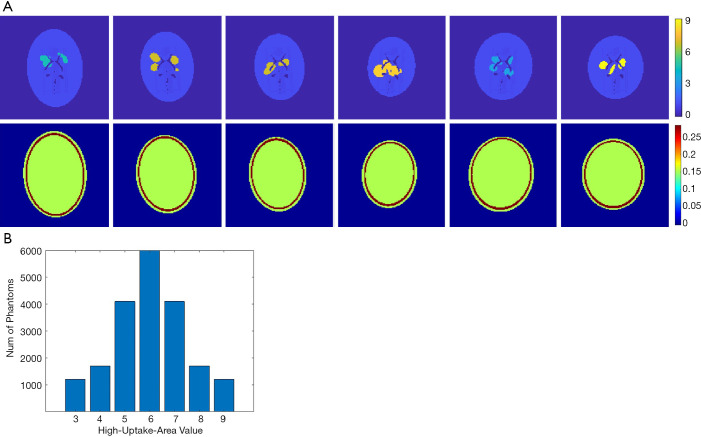
Figure 1.
Training data and statistics. (A) Generated random 2-D head phantoms by custom software. The first row shows the activity images. The high-uptake area is assigned to 3–9 and the rest area in the head is assigned to one. The background is zero. The second row shows the attenuation map image corresponding to the first row. (B) The number of phantoms meets standard normal distribution according to the assigned values of the high-uptake area in the activity image. Assigned value equal to 6 is the most cases in the database.

