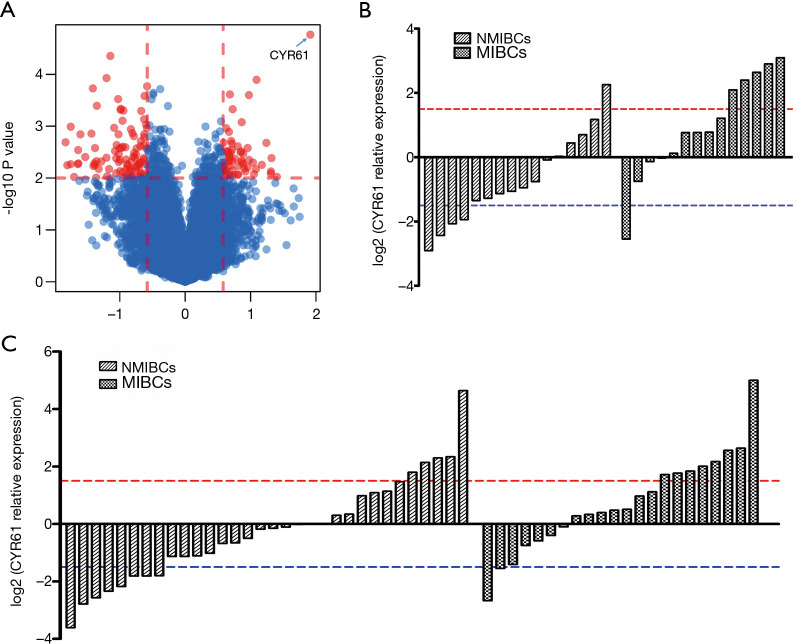
Figure 1.
Significant difference of CYR61 expression between NMIBCs and MIBCs. (A) Volcano plot shows different gene expressions between NMIBCs and MIBCs. Two vertical lines represent the 1.5-fold change boundaries, and the horizontal line is the statistical significance boundary (P<0.01). Genes with ≥2-fold change and statistical significance are marked with red dots. (B) First phase of validation and relative expression level of CYR61 of screening set (30 samples) tested by qRT-PCR. (C) Second phase of validation. Relative expression level of CYR61 in 32 NMIBCs and 22 MIBCs of independent set tested by qRT-PCR. CYR61, cysteine-rich angiogenic inducer 61; NMIBC, non-muscle-invasive bladder cancer; MIBC, muscle-invasive bladder cancer; qRT-PCR, quantitative reverse transcription polymerase chain reaction.

