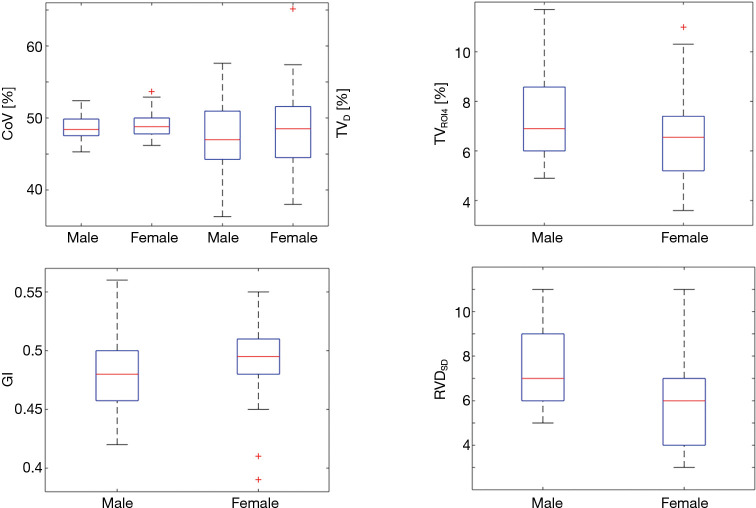
Figure 3.
Boxplot of the EIT-based parameters of male and female subjects. The boxes mark the quartiles while the whiskers extend from the box out to the most extreme data values within 1.59 of the sample’s interquartile range. EIT, electrical impedance tomography; CoV, center of ventilation; TVD, dorsal fraction of ventilation; TVROI4, ventilation distribution in the most dependent region; GI, the global inhomogeneity index; RVDSD, the standard deviation of the regional ventilation delay index.

