
Figure 3.
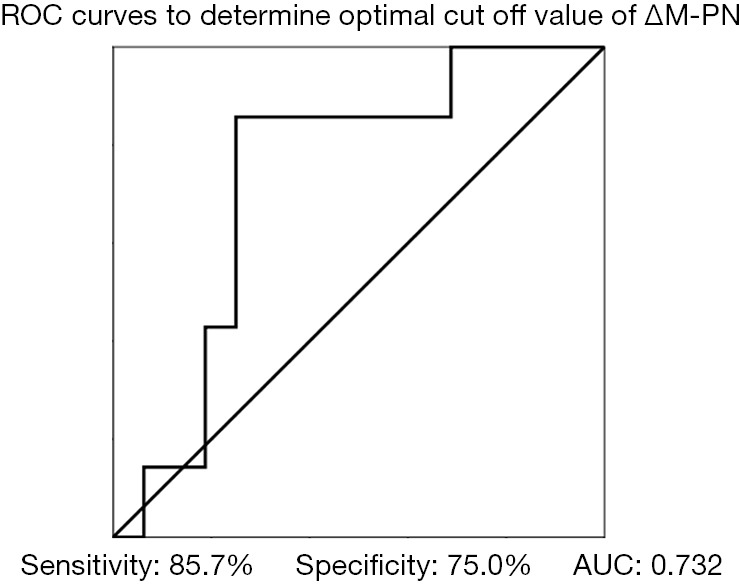
ROC curves to determine the optimal cutoff value of ΔM-PN (expressed as change in M-PN from day 0 to day 7) for predicting survival, which was −2.7 ng/mL (sensitivity, 85.7%; specificity, 75.0%; area under the curve, 0.732).
Official websites use .gov
A
.gov website belongs to an official
government organization in the United States.
Secure .gov websites use HTTPS
A lock (
) or https:// means you've safely
connected to the .gov website. Share sensitive
information only on official, secure websites.
ROC curves to determine the optimal cutoff value of ΔM-PN (expressed as change in M-PN from day 0 to day 7) for predicting survival, which was −2.7 ng/mL (sensitivity, 85.7%; specificity, 75.0%; area under the curve, 0.732).