Figure 2.

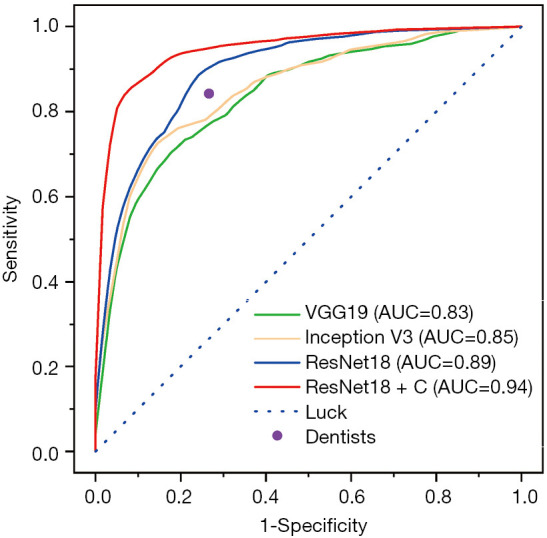
The ROC curve of four models and the accuracy of dentists. The AUC of the four models is labelled. The purple point represents the average levels of comparator dentists.

The ROC curve of four models and the accuracy of dentists. The AUC of the four models is labelled. The purple point represents the average levels of comparator dentists.