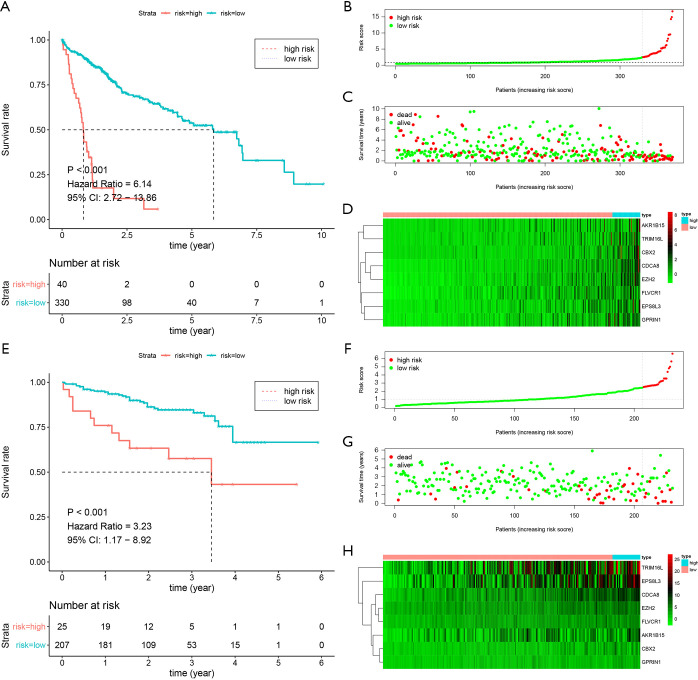
Figure 4.
The Kaplan-Meier curves and the distribution of risk score, vital statuses, and CNV-driven genes expression. (A,E) K-M curves for the prognostic model in the TCGA set and ICGC set, respectively. (B,C,D) The distribution of risk score based on CNV-driven genes, the vital statuses of patients, and heatmap of the genes profiles in the TCGA set. (F,G,H) The risk score distribution, the vital statuses of patients, and heatmap of the gene profiles in the ICGC set. CNV, copy number variation; TCGA, The Cancer Genome Atlas; ICGC, International Cancer Genome Consortium.

