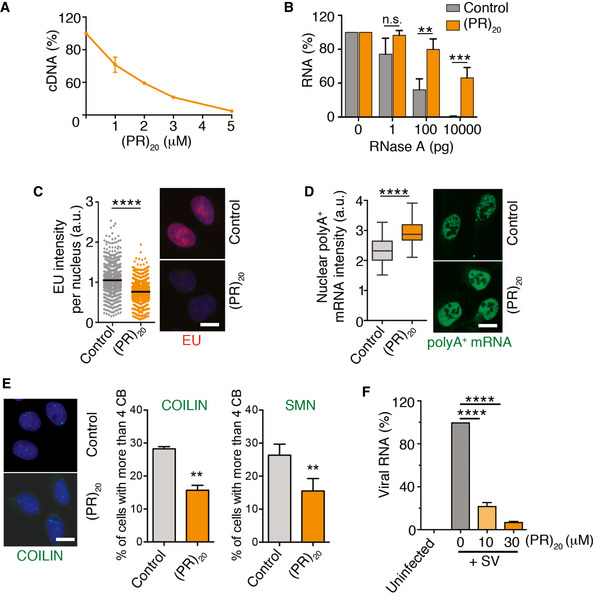
Figure 2. (PR)20 peptides impair reactions using RNA substrates in vitro and in vivo .

-
AReverse transcription of RNA (500 ng) with oligo dT in the presence of increasing doses of (PR)20. Data represent the fluorometric quantification of the resultant cDNA (n = 3), mean values ± SD.
-
BPercentage of RNA (1 μg) remaining after a 15′ digestion with increasing doses of RNase A in the presence or absence of (PR)20 (5 μM; n = 3). Data represent mean values ± SEM.
-
C, DHigh‐throughput microscopy (HTM)‐mediated analysis of 5‐ethynyl‐uridine (EU) (C) and polyA+ mRNA (D) levels per nucleus found in U2OS cells exposed to 10 μM (PR)20 for 16 h. EU was added 30′ prior to fixation (n = 3). Black lines indicate median values in both panels. In (D), boxes define upper and lower quartiles and whiskers mark the highest and lowest observations.
-
EEffect of (PR)20 (10 μM, 16 h) in the number of Cajal Bodies (CB) identified by immunofluorescence with anti‐COILIN and anti‐SMN antibodies (n = 3). Data represent mean values ± SD.
-
FAccumulation of Sindibis virus (SV) genomic RNA in BHK‐21 cells in the absence or presence of increasing doses of (PR)20. The amount of viral and cellular RNA was quantified from total RNA isolated 4 h after infection by quantitative real‐time PCR (qRT–PCR) with specific primers (n = 3). Data represent mean values ± SEM.
Data information: **P < 0.01; ***P < 0.001; ****P < 0.0001; t‐test. Representative images from these analyses (C–E) are provided in each case. Scale bar (white) indicates 2–5 μm. See also Appendix Fig S1.
