-
A
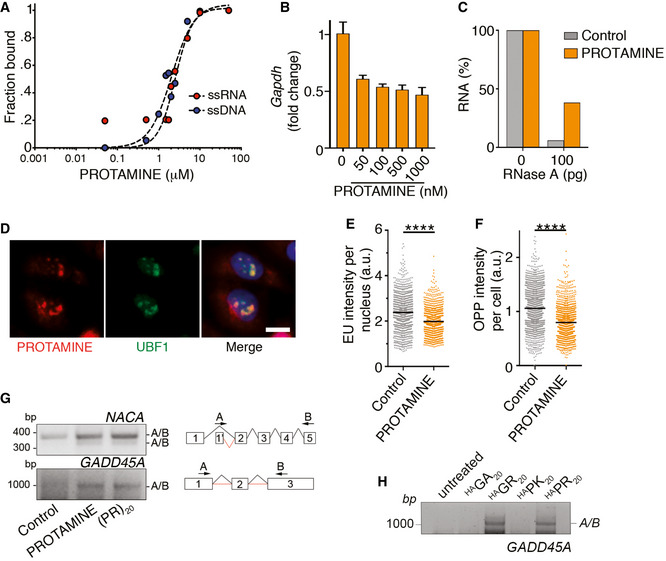
Quantification of EMSA assays evaluating the binding of protamine to 19 nt‐long ssDNA and ssRNA molecules. Each probe (0.2 μM) was incubated with increasing concentrations of (PR)20 for 10′. Curve fitting was performed using non‐linear regression with the Hill equation.
-
B
Percentage of GAPDH levels quantified by qPCR in reactions containing increasing doses of protamine (n = 3). Data represent mean values ± SEM.
-
C
Percentage of RNA (1 μg) remaining after a 15′ digestion with increasing doses of RNase A in the presence or absence of protamine (5 μM). Data derive from one representative experiment that was repeated twice.
-
D
Immunofluorescence of Cy3‐labelled salmon protamine (red) and the nucleolar factor UBF1 (green) in U2OS cells treated with 30 μM Cy3‐protamine for 4 h. Scale bar (white) indicates 2.5 μm.
-
E, F
HTM‐mediated quantification of the EU levels per nucleus (E) and O‐propargyl‐puromycin (OPP) levels per cell (F) in U2OS cells exposed to 30 μM protamine for 16 (E) or 24 (F) h. EU and OPP were added 30′ prior to fixation. Black lines indicate median values (****P < 0.0001; t‐test).
-
G
RT–PCR of NACA and GADD45A mRNAs in U2OS cells treated with protamine (30 μM) or (PR)20 (20 μM) using primers in non‐consecutive exons to monitor alternative splicing events. A scheme of the primers used is provided on the right side of the panel.
-
H
RT–PCR of GADD45A mRNAs in U2OS cells treated with HA‐tagged (PR)20, (GR)20, (PK)20 and (GA)20 peptides (20 μM) using the pipeline defined in (G).

