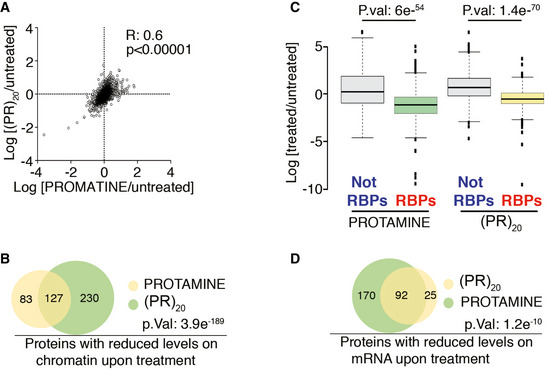
Figure 5. Arginine‐rich peptides trigger a widespread displacement of proteins from chromatin and RNA.

- Distribution of the chromatin‐bound levels of all proteins identified by proteomics in U2OS cells treated with protamine (30 μM) or (PR)20 (20 μM) for 90′. Numbers indicate the Pearson's correlation coefficient (R) and the P‐value, which was obtained by a t‐test to evaluate the Pearson correlation between both samples.
- Venn diagram illustrating the overlap among the proteins that show reduced levels on chromatin upon treatment of U2OS cells with protamine (30 μM) or (PR)20 (20 μM) for 90′. The P‐value was obtained by a hypergeometric test. See also Table S2.
- Distribution of the levels of all proteins identified after isolation of the RNA‐bound proteome in U2OS cells treated with protamine (30 μM) or (PR)20 (20 μM) for 180′. RNA‐binding proteins (RBPs) were identified as those significantly enriched after the isolation of mRNA‐binding factors. Note that treatment with either peptide leads to a selective reduction in the levels of RBPs bound to mRNA that is not observed for the rest of the factors (Not RBPs) (n = 2). P values were calculated with two‐sided two‐sample t‐tests assuming equal variances. Center lines indicate median values; box limits indicate the 25th and 75th percentiles; whiskers extend 1.5 times the interquantile range from the 25th and 75th percentiles and outliers are represented by dots.
- Venn diagram illustrating the overlap among the proteins that show reduced levels on mRNA upon treatment of U2OS cells with protamine (30 μM) or (PR)20 (20 μM) for 90′. The P‐value was obtained by a hypergeometric test. See also Appendix Table S2.
