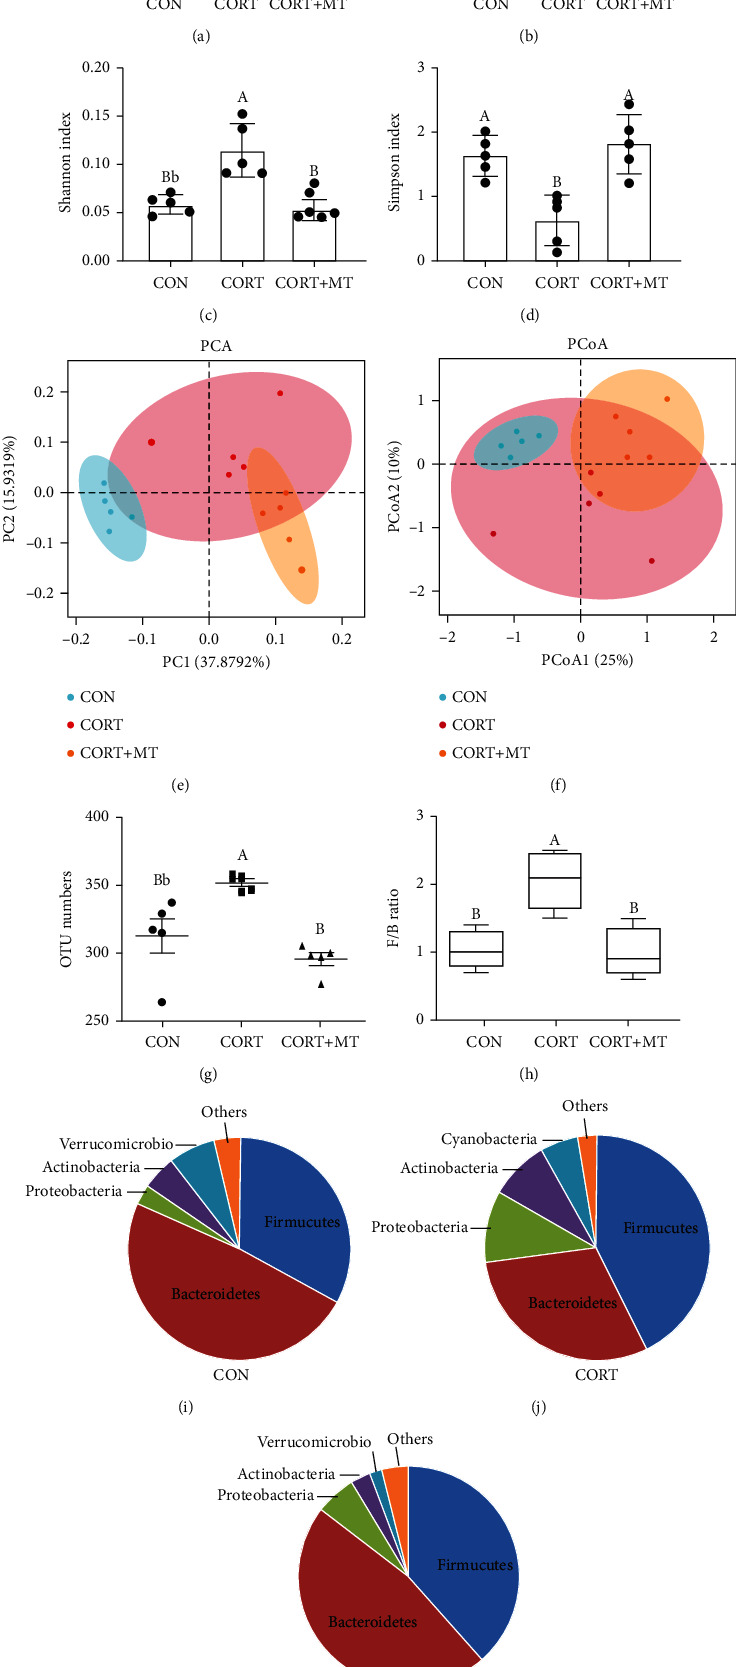
Figure 3.

Effect of melatonin supplementation on improving CORT-induced colonic gut microbiota composition dysbiosis. The α-diversity includes diversity and richness. ACE index (a), Chao1 index (b), Shannon index (c), and Simpson index (d). The β-diversity shows the dispersion of each sample. Principal component analysis (PCA) (e) and PCoA score plot (f) score plot based on the Bray-Curtis score plot based on the OTU in the colon; OTU number (g); F : B ratio (h) and relative contribution of the top 4 phyla (I-K) in the CON (i), CORT (j), and CORT+MT (k) groups. Values are presented as the mean ± SE. Differences were assessed using ANOVA and are denoted as follows: different lowercase letters: p < 0.05; different uppercase letters: p < 0.01; and the same letter: p > 0.05.
