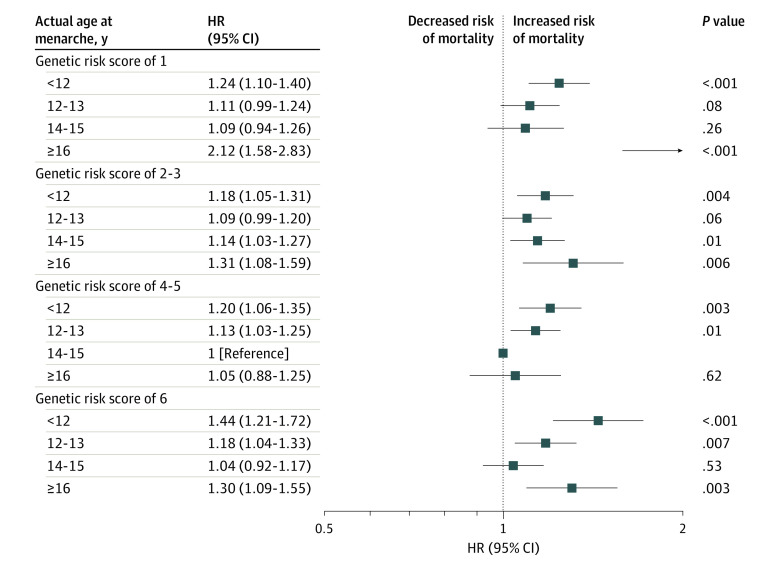
Figure 3. Interaction Between Actual Age and Genetically Determined Age at Menarche With Mortality.
Analyses are adjusted for age; race/ethnicity; Townsend deprivation index; smoking status; alcohol consumption status; physical activity; menopause status; parity; body mass index; healthy diet score; birth weight; assessment center; history of cancer, diabetes, cardiovascular disease, hypertension, and high cholesterol level; the first 5 genetic principal components; and genotyping array. HR indicates hazard ratio.

