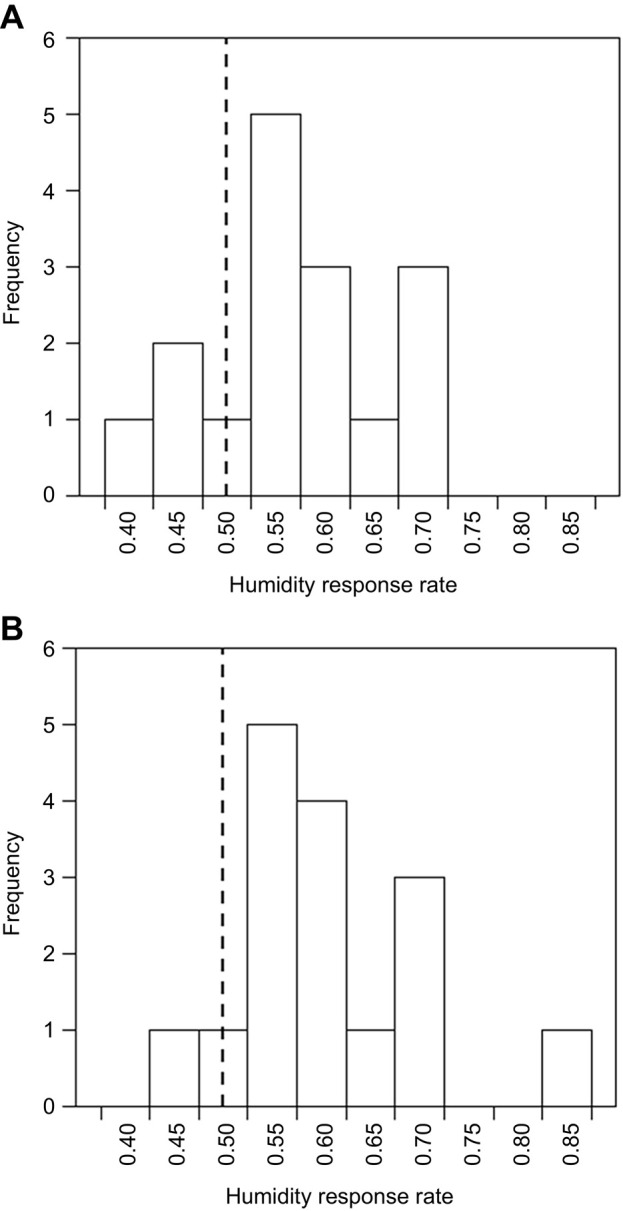
Fig. 5.

Histograms showing the responses of bumblebees to rewarding passive and active flowers in the preference experiments. (A) Passive flowers; (B) active flowers. Bars represent the frequency of bees (n=16 bees in each trial) that over 20 flower landings achieved each humidity response rate (the proportion of landings in which the response of the bee was in favour of the elevated floral humidity of humid flowers, as opposed to the lower floral humidity of dry flowers). Dashed vertical line indicates the expected humidity response rate for randomly foraging bees (0.5).
