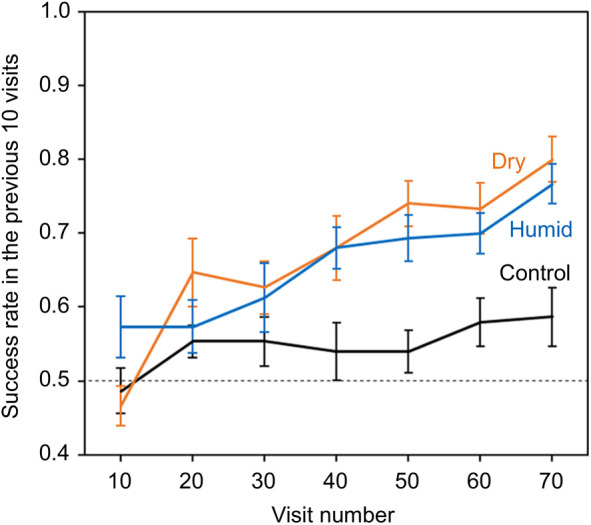
Fig. 6.

The relationship between bees' foraging success and experience of passive artificial flowers (flower visits the bee made). Dotted line indicates the 50% success level. Solid lines indicate the mean foraging success of bees in the previous 10 visits. Error bars represent ±s.e.m. Colour and label of solid lines and error bars correspond with test group: black, control group; orange, dry reward group; blue, humid reward group. Number of bees in each test group, n=15.
