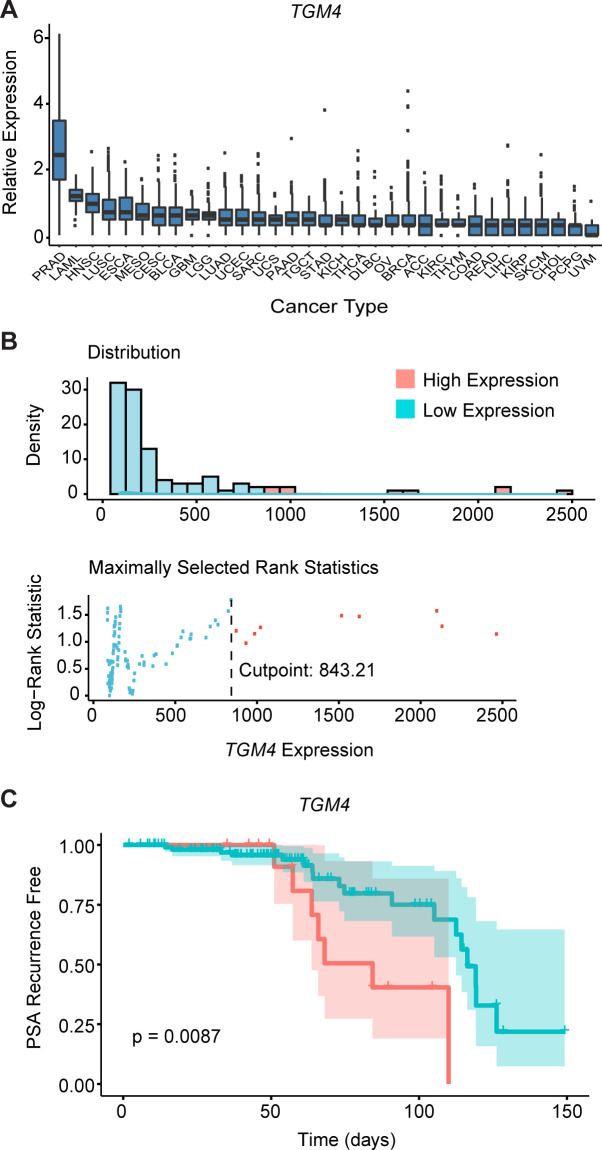
Figure 3.
TGM4 expression is maintained by prostate tumor cells. (A) Relative expression of TGM4 across human cancer types in TCGA database, including 558 primary PRADs.73 Boxplots of Log10 (TPM) normalized gene expression are shown, with cancer types ordered by decreasing TGM4 expression. (B) Optimal cutpoint for TGM4 expression. Top: distribution of TGM4 expression across primary PRADs (n=218, GSE21032).28 Bottom: the overall log-rank p value for TGM4 expression is plotted. A vertical line is drawn at the optimal cutpoint of 843.21. (C) Kaplan-Meier curves comparing biochemical recurrence-free survival of patients with PRADs, with log-rank p value reported from multiple Cox regression of biochemical recurrence-free against TGM4 expression levels (high TGM4, n=24; low TGM4, n=107). Biochemical recurrence was determined as an increase in PSA serum levels of ≥0.2 ng/mL on two occasions as described in the Materials and methods section. PRAD, prostate adenocarcinoma; TCGA, The Cancer Genome Atlas; TGM4, Transglutaminase 4.

