
Fig. 2.
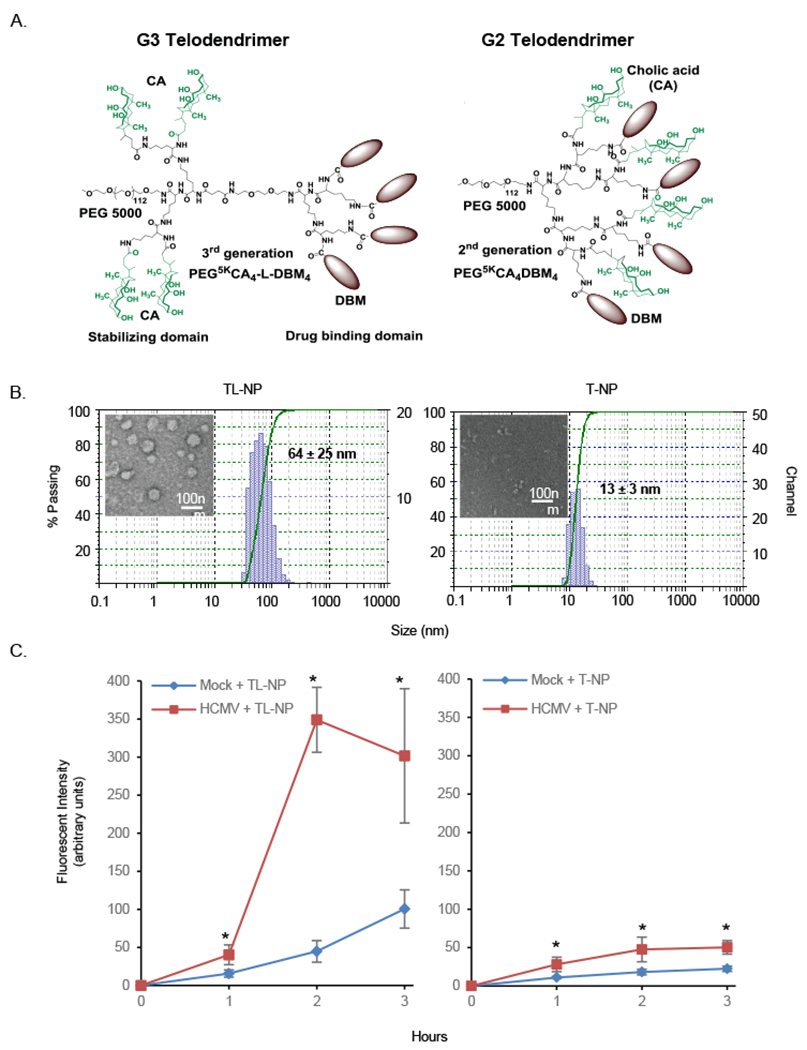
Nanoparticles are rapidly engulfed into HCMV-infected monocytes. (A) Structures of the functional-segregated G3 (left) and G2 (right) telodendrimers. (B) Hydrodynamic size distributions and TEM images of blank TL-NP and T-NP nanoparticles. (C) Peripheral blood monocytes were mock infected or HCMV infected for 24 hours (h). Following infection, FITC-labeled TL-NP or T-NP was added to infected cells for 1, 2, and 3 h then washed with PBS to remove the nanocarriers and fluorescent intensities immediately determined with a Nikon Eclipse Ti-U inverted fluorescent microscope. Results are from 3 independent experiments from different blood donors. Differences between experimental groups were evaluated by one-way analysis of variance (ANOVA) with pair-wise multiple comparison procedures. Asterisk (*) represents a P value of <0.05.