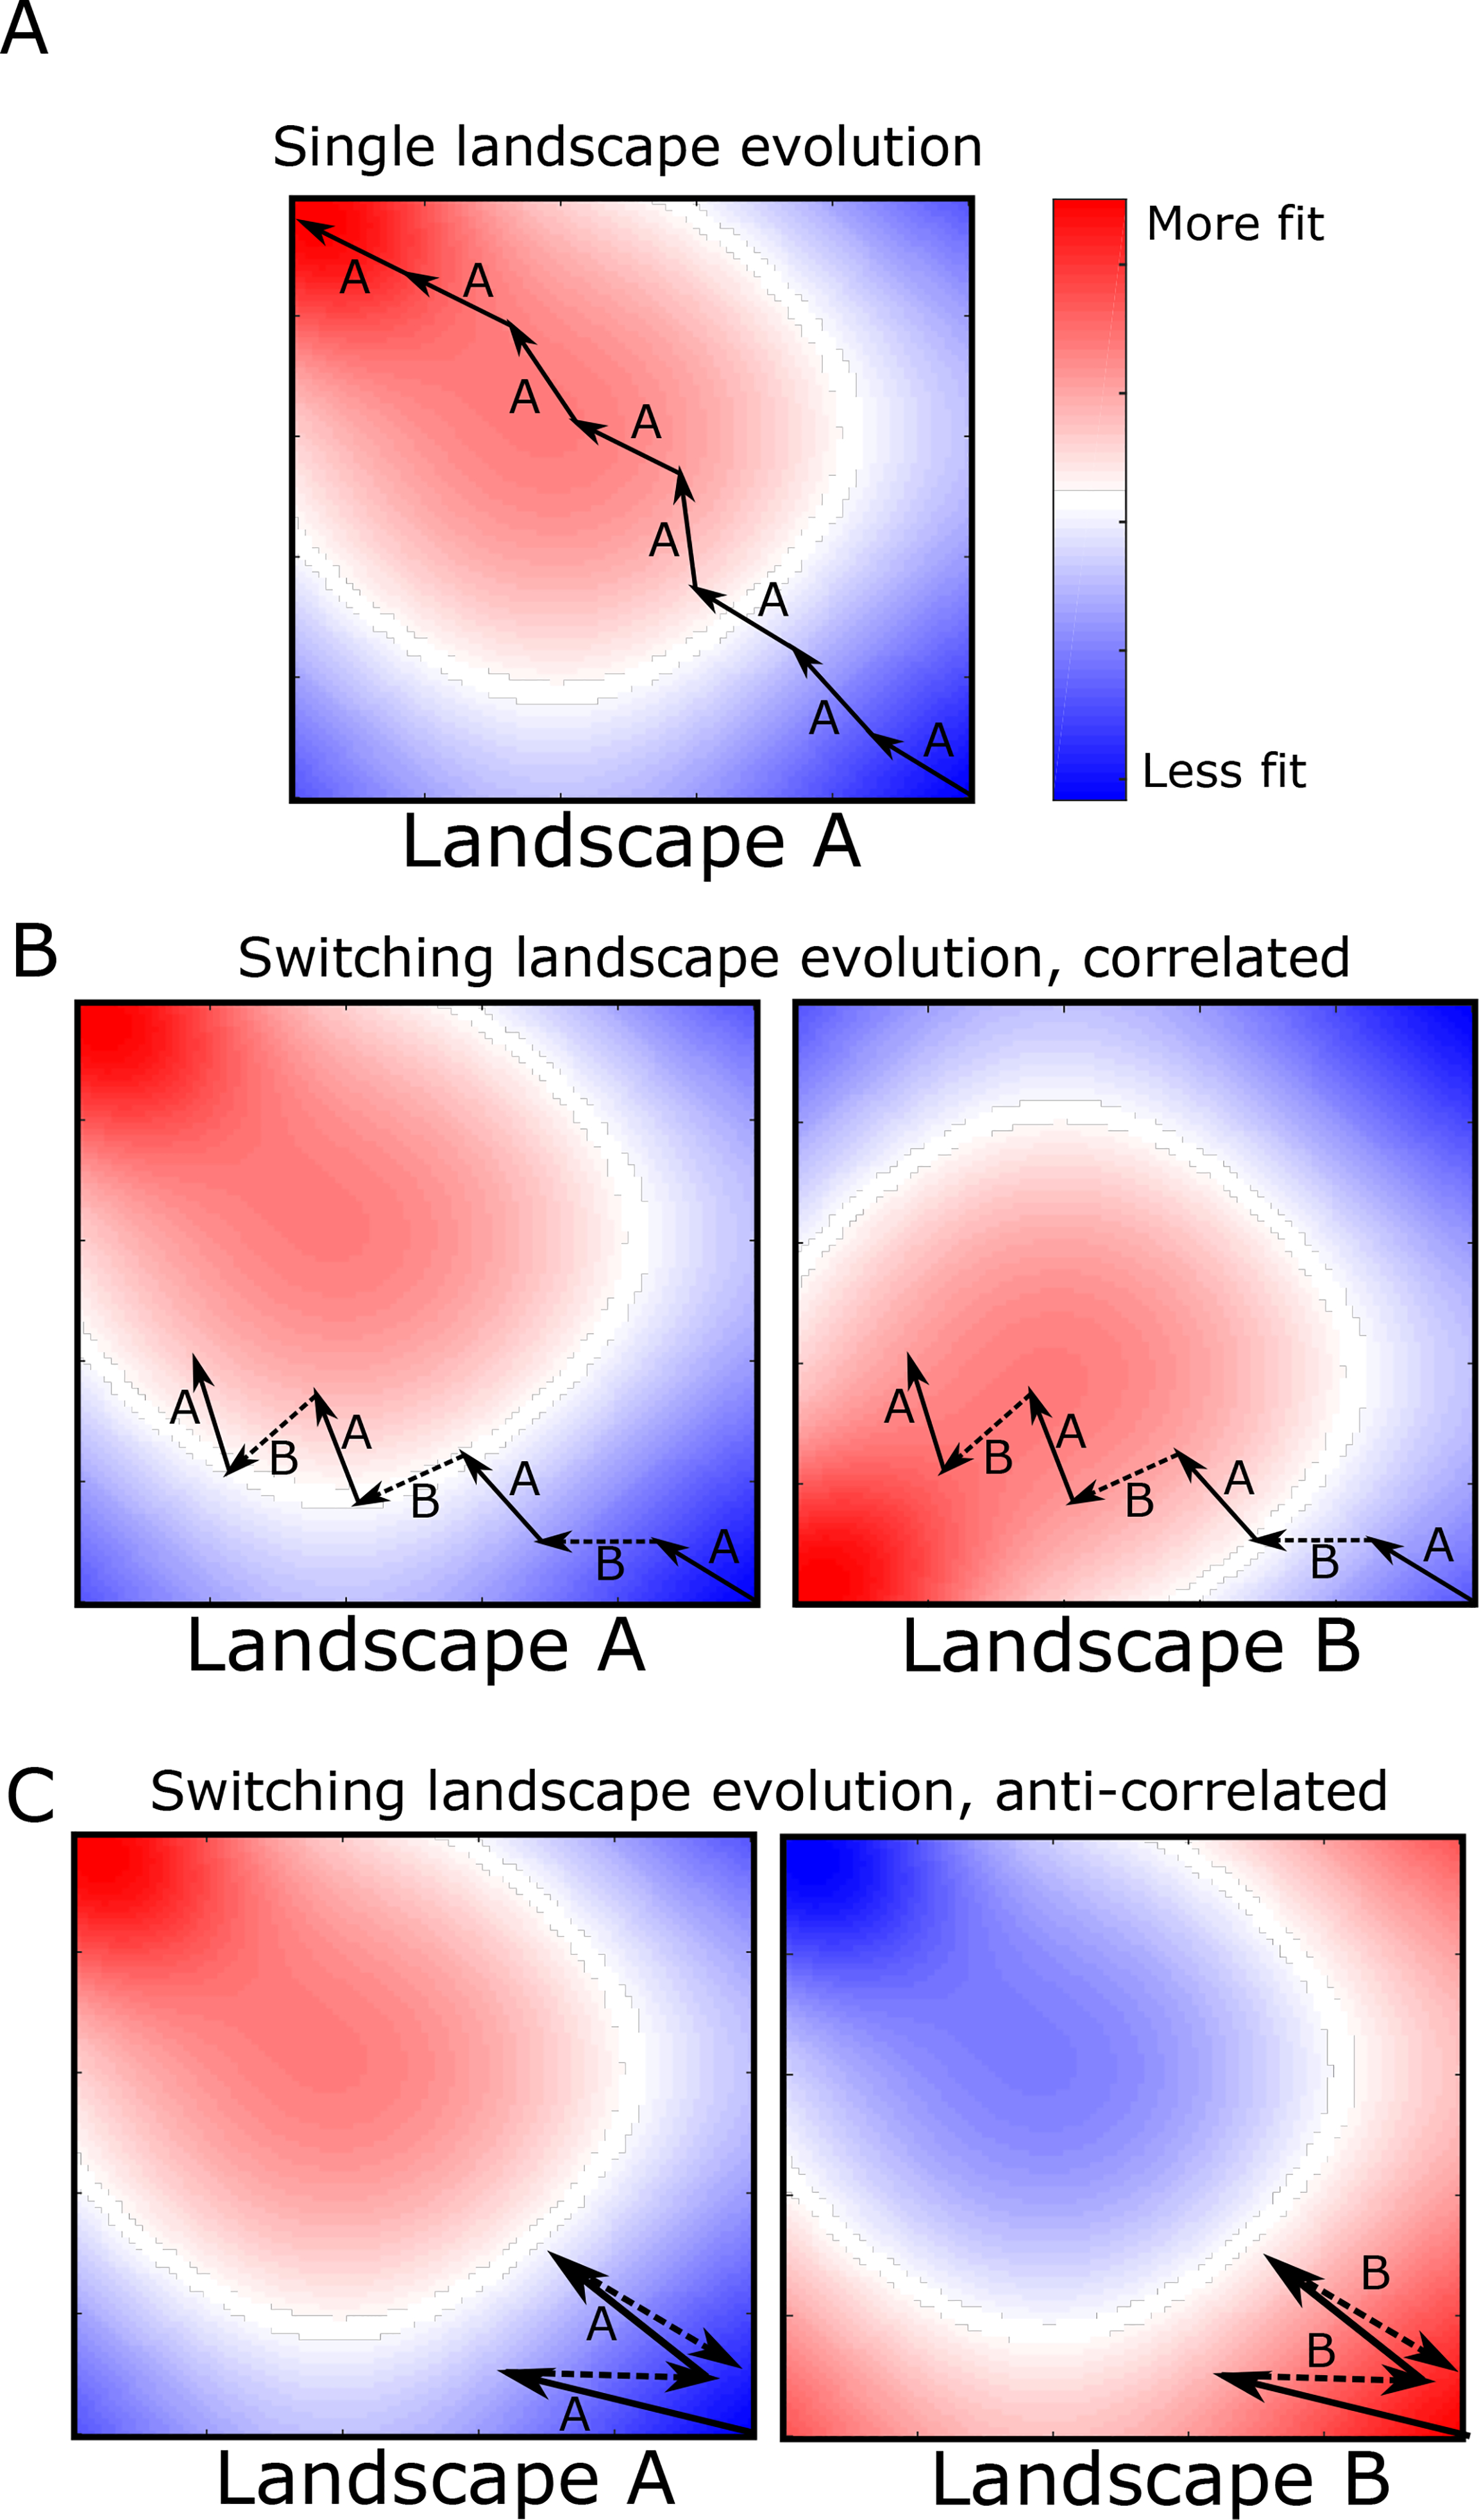
FIG. 1: Adaptation to alternating landscapes may depend on inter-landscape correlations.

A. Schematic fitness landscape, with fitness varying from less fit (blue) to more fit (red) over the two dimensional genotype space. Starting from a single genotype (lower right hand corner), adaptation follows a biased random walk (arrows) toward local fitness maxima (in this case, in the upper left side of the landscape). B and C. Fitness landscapes A and B are positively (B) or negatively (C) correlated and do not share a global fitness maximum. Adaptation under rapid alternation of landscapes A and B leads to an altered evolutionary trajectory (represented as arrows, with solid arrows indicating steps in A and dashed arrows steps in B). In this example, the final fitness achieved in both correlated (panel B) and anti-correlated (panel C) landscapes is lower than that of static landscape evolution (panel A). Adaptation to anti-correlated landscapes leads to a particularly significant decrease in final fitness, as each step in B effectively reverses the progress made the previous step in A.
