
FIG. 2: Rugged landscapes trap populations in non-optimal fitness maxima.
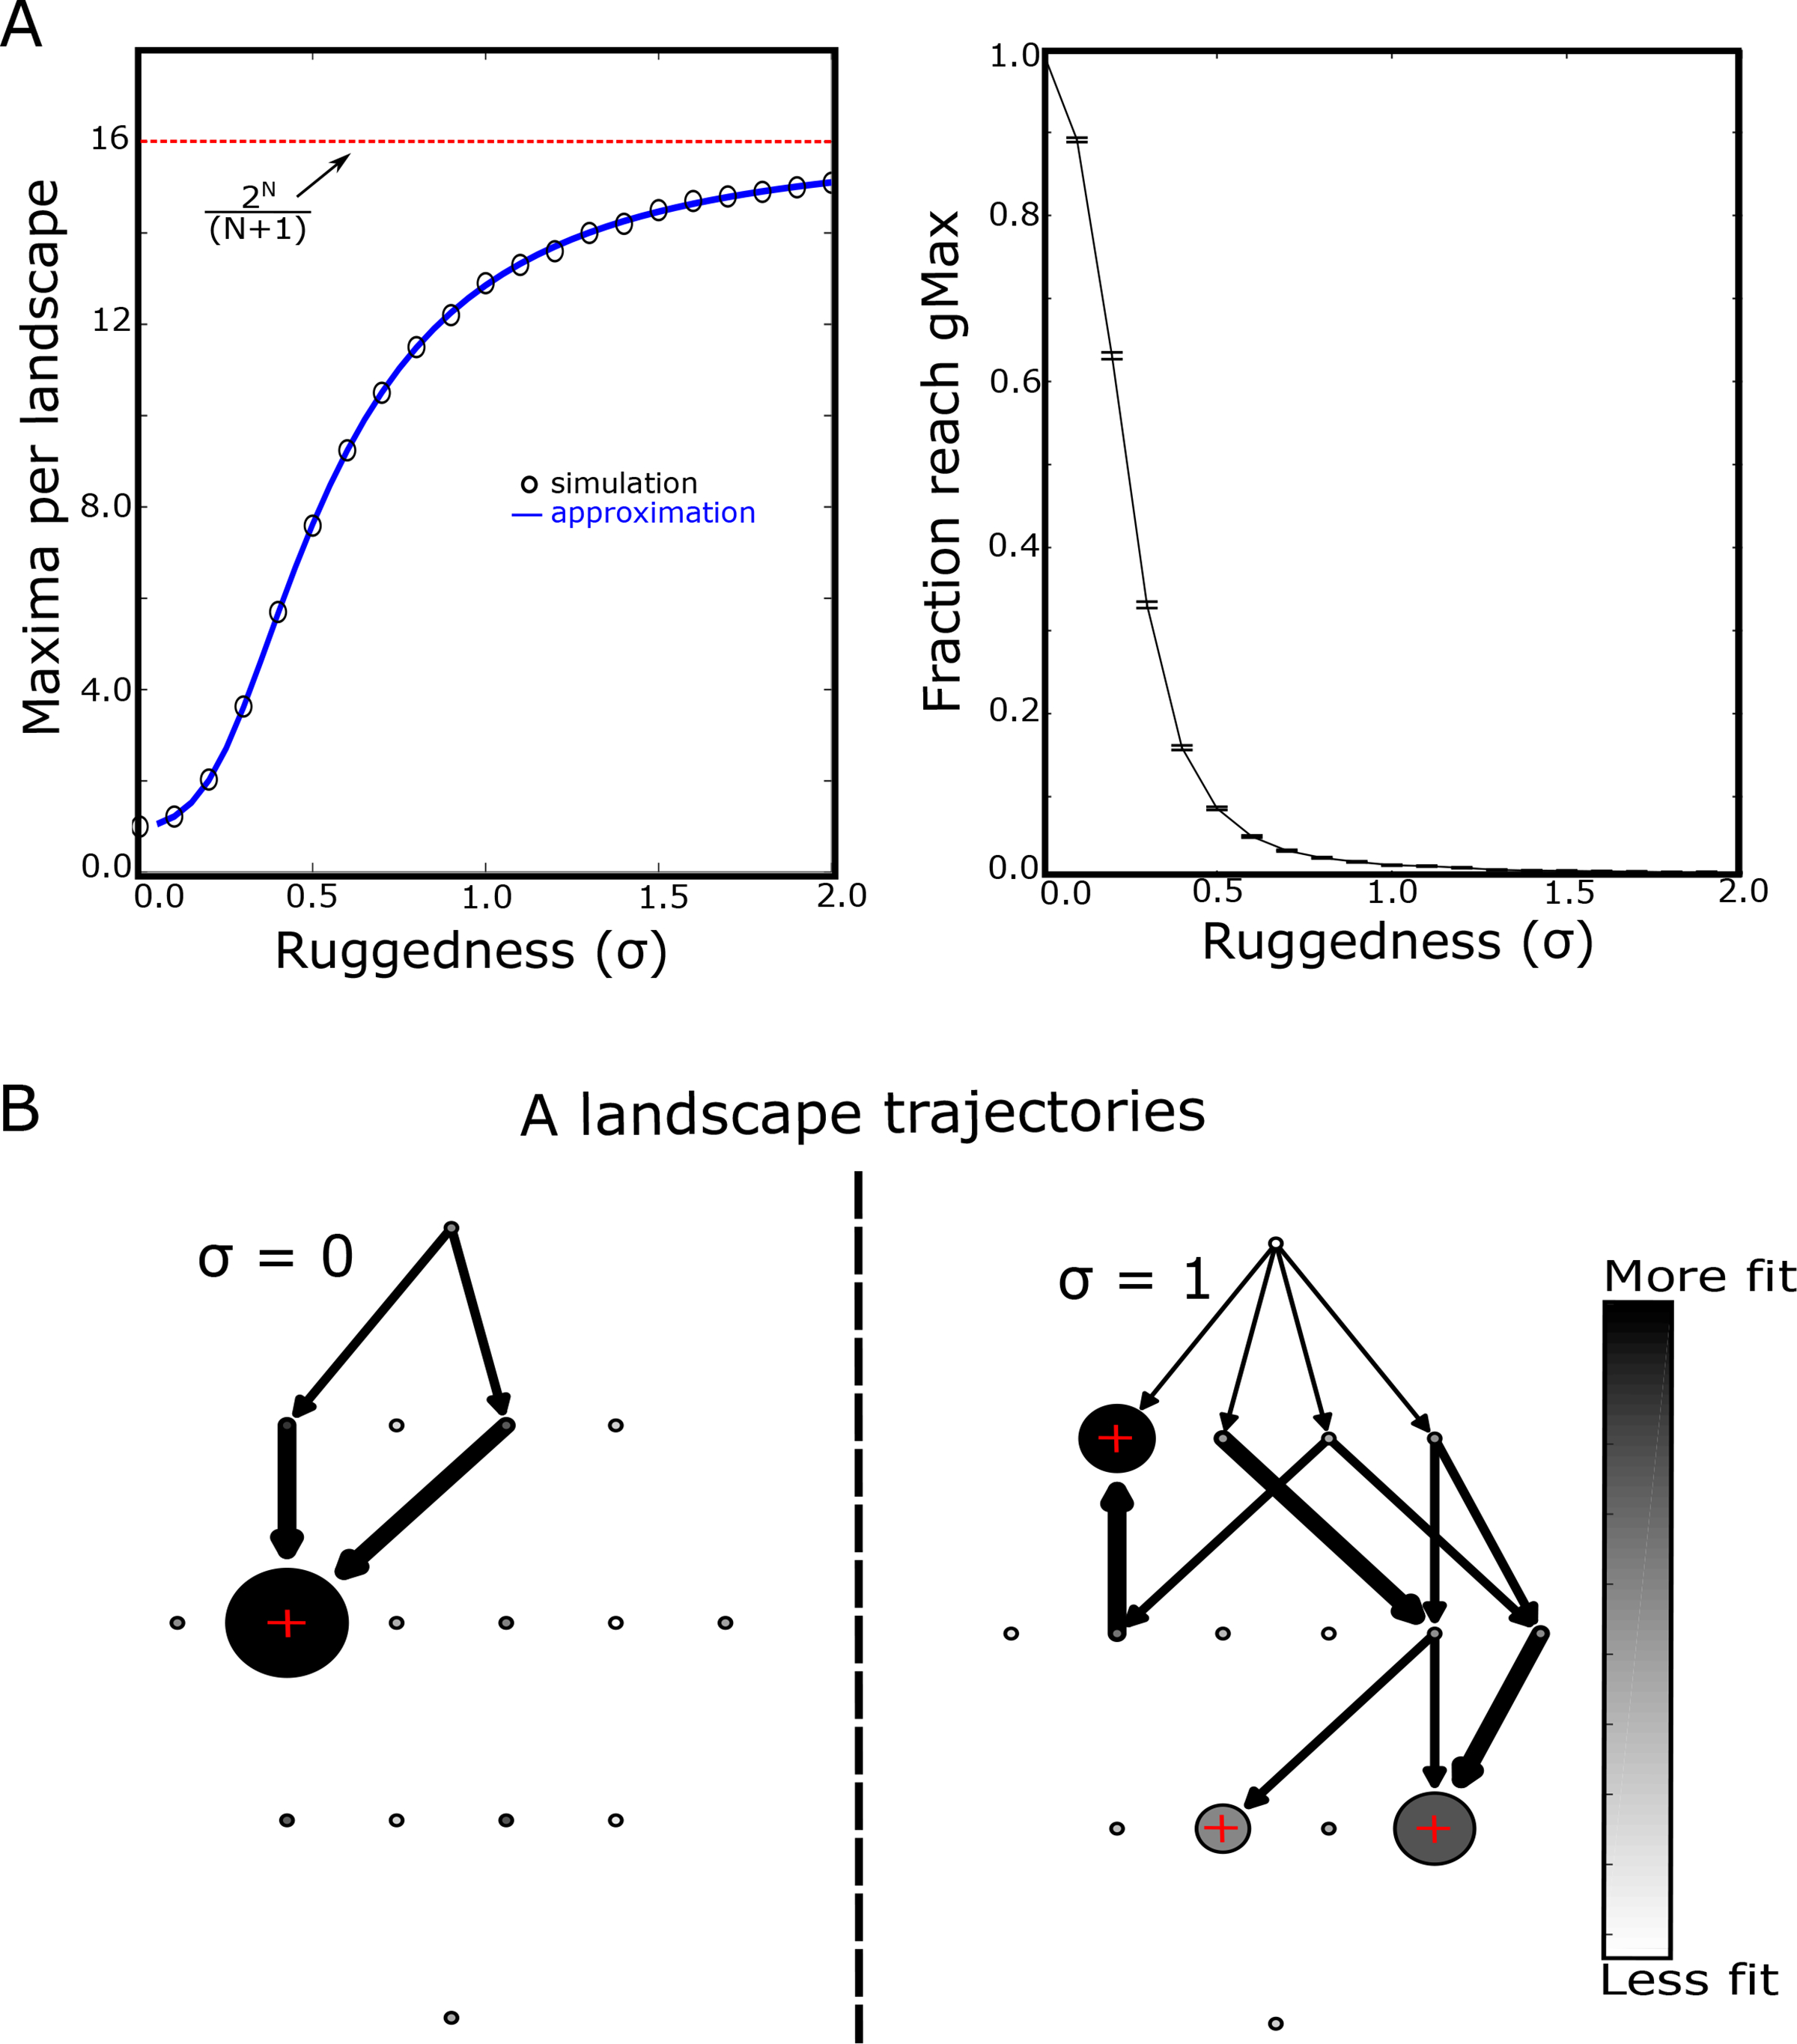
A. Left panel: average number of local fitness maxima per landscape as a function of increasing ruggedness (epistasis, σ). Circles are estimates from simulations, solid curve is semi-analytical approximation (see SI), and dotted red line is the theoretical maximum (2N/(N + 1) = 16). Right panel: fraction of adapted populations that reach the global fitness maximum value as a function of ruggedness. Error bars are ± standard error of the mean in the ensemble of landscapes. B. Sample adaptive trajectories for small landscapes (N = 4) and σ = 0 (left) or σ = 1 (right). Each circle represents a genotype, with the ancestral genotype at the top. The shading of the circle represents the relative fitness of that genotype (ranging from less fit, white, to more fit, black) and the size of the circle indicates occupation probability in the steady state. Red + symbols mark genotypes corresponding to local fitness maxima. Arrows represent transitions between genotypes that occur with nonzero probability given that adaptation begins in the ancestral genotype. The width of the arrow represents the magnitude of the transition probability.