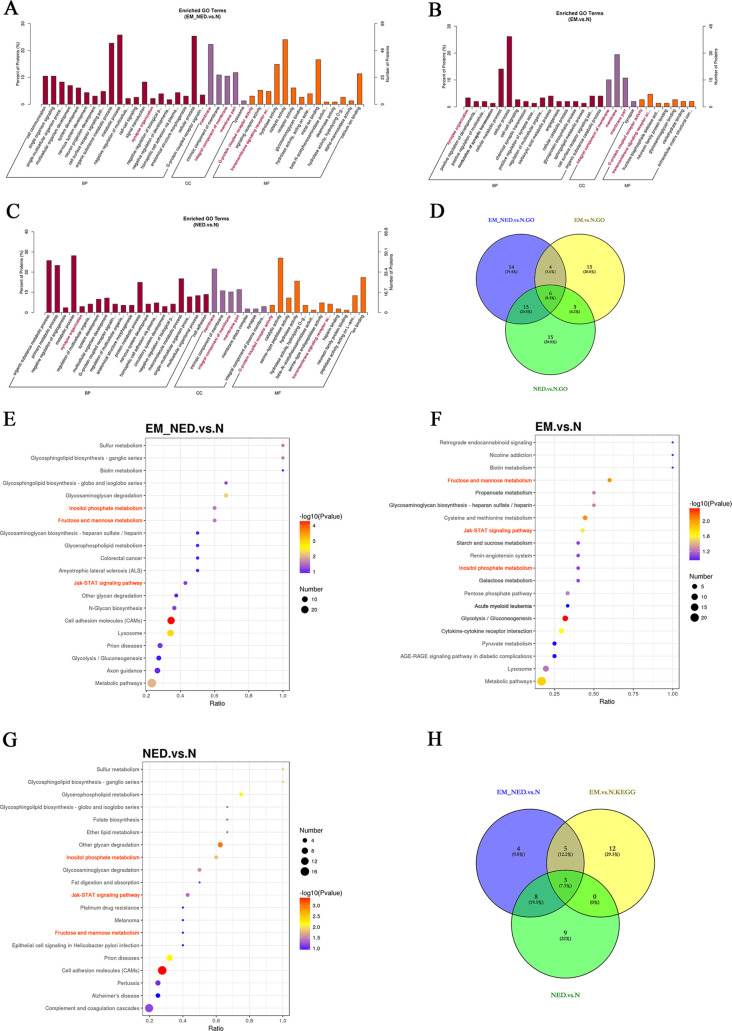
Figure 3.
GO and KEGG analysis. (A) Enriched GO terms between the EM_NED and N groups. (B) Enriched GO terms between the EM and N groups. (C) Enriched GO terms between the NED and N groups. (D) Overlap of the enriched GO function among the EM, EM_NED, and N groups. (Six of these intersection functions were highlighted in red in (A–C).) (E) KEGG terms between the EM_NED and N groups. (F) KEGG terms between the EM and N groups. (G) KEGG terms between the NED and N groups. (H) Overlap of the KEGG function among the EM, EM_NED, and N groups. (Three of these intersection functions were highlighted in orange in (E–G).)

