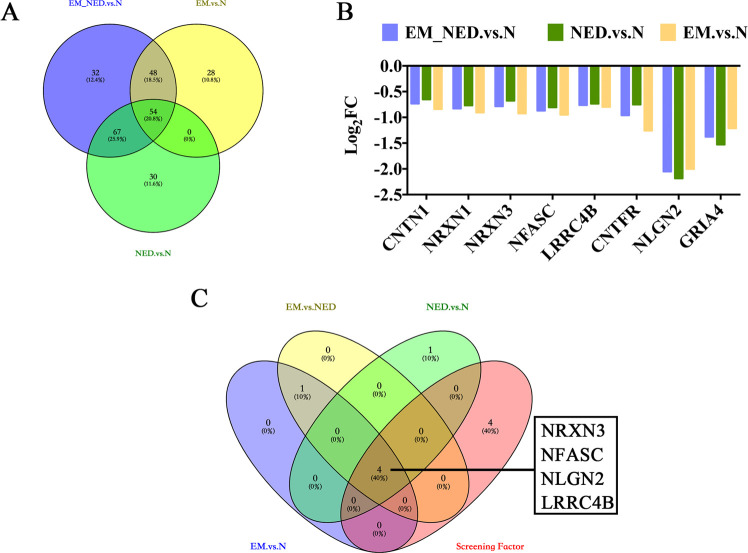
Figure 4.
Protein screening. (A) Venn’s plots of downregulated proteins. (B) Log2FC of neural-related 8 of the 54 downregulated proteins in the overlap of the EM_NED vs N, NED vs N, and EM vs N. (C) Venn’s plots of upregulated proteins among EM vs N, NED vs N, and EM vs NED associated with synapse organization and neural-related 8 proteins.

