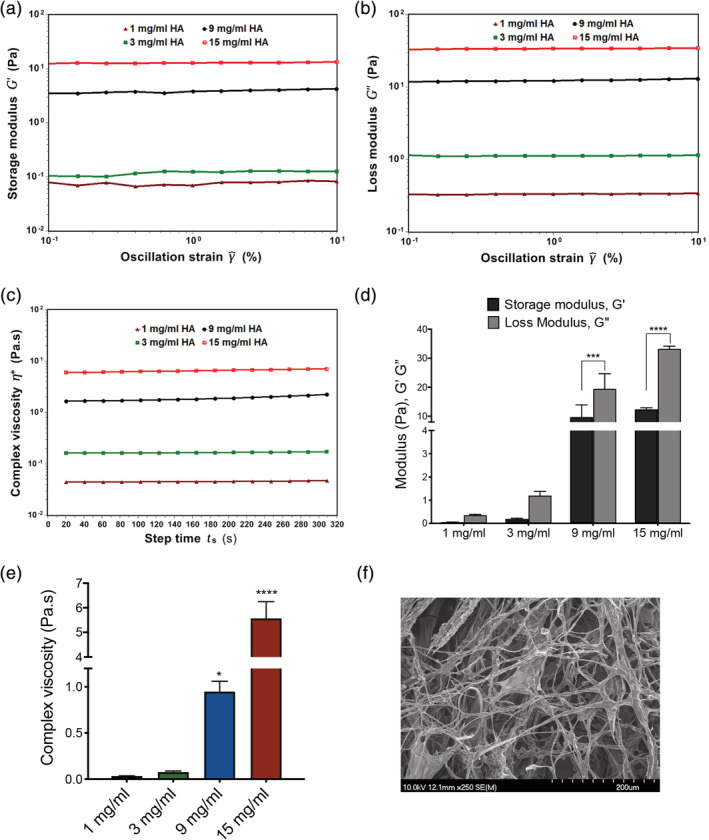
FIGURE 1.

Dynamic oscillatory amplitude, time sweep curves of different naïve HA concentrations effect on viscoelastic properties: (a‐c) Representative viscoelastic curves of storage modulus, G′ (Pa), loss modulus, G″ (Pa), complex viscosities (Pa.s) of different naïve HA solutions. (d) Comparison of G′, G″ of different naïve HA concentration solutions; (e) Comparison of complex viscosities of different HA concentrations. (f) A representative SEM image of freeze‐dried naïve HA solution (3 mg/ml). Data in 1d is represented as mean ± SD, Two‐way ANOVA, Sidak's multiple comparisons test. *** p < 0.001, **** p < 0.0001‐ G′ versus G″ at 9, 15 mg/ml, respectively. Data in 1e is represented as mean ± SD, One‐way ANOVA, post hoc Tukey test. * p < 0.05 versus 1 mg/ml; **** p < 0.0001 versus 1 mg/ml
