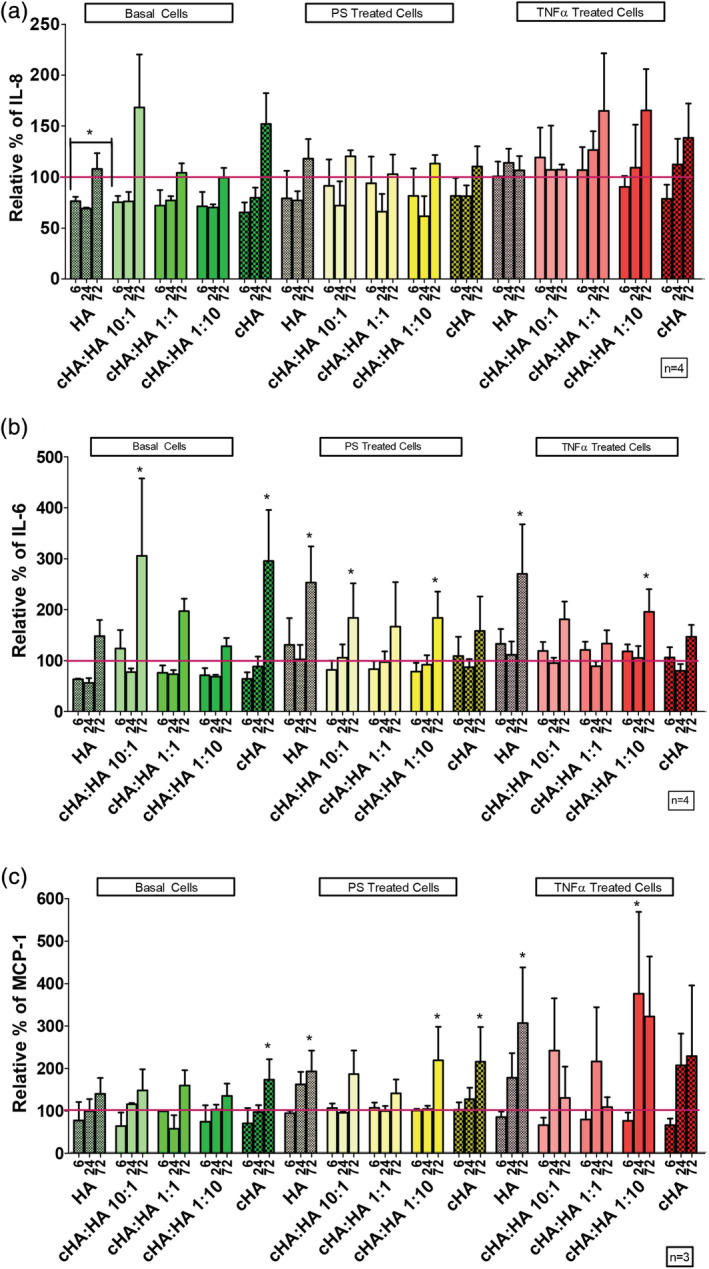
FIGURE 5.

The effect of cHA:HA ratios at 3 mg/ml on inflammatory cytokines. (a) Comparison of different ratios of cHA:HA at 3 mg/ml on secreted IL‐8 levels compared to control (red line) from HTB‐2 cells over 6, 24, and 72 hrs. (b) Comparison of different ratios of cHA:HA at 3 mg/ml on secreted IL‐6 levels compared to control (red line) from HTB‐2 cells over 6,24 and 72 hours. (c) Comparison of different ratios of cHA:HA at 3 mg/ml on secreted MCP‐1 compared to control (red line) levels from HTB‐2 cells over 6, 24, and 72 hrs. Statistical significance indicated as *p < 0.05 compared to control cells at same time point
