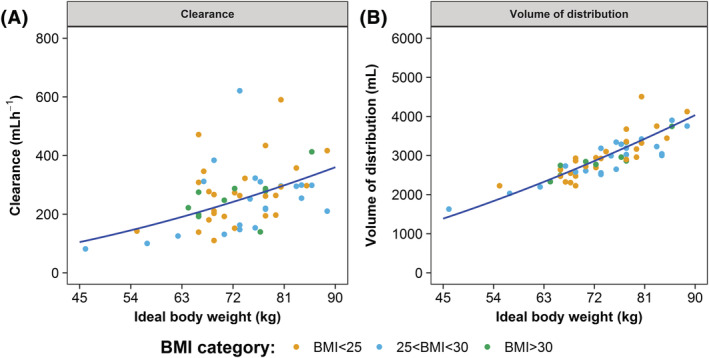
FIGURE 1.

Clearance and volume of distribution increase when ideal body weight increases. (A) Clearance. (B) Volume of distribution of the central compartment. The individual PK parameter estimates were obtained by posthoc analysis using the final model. The blue line depicts the typical values, as calculated using the final model vs ideal body weight. In both figures, an increase is demonstrated for the typical value with increasing ideal body weight
