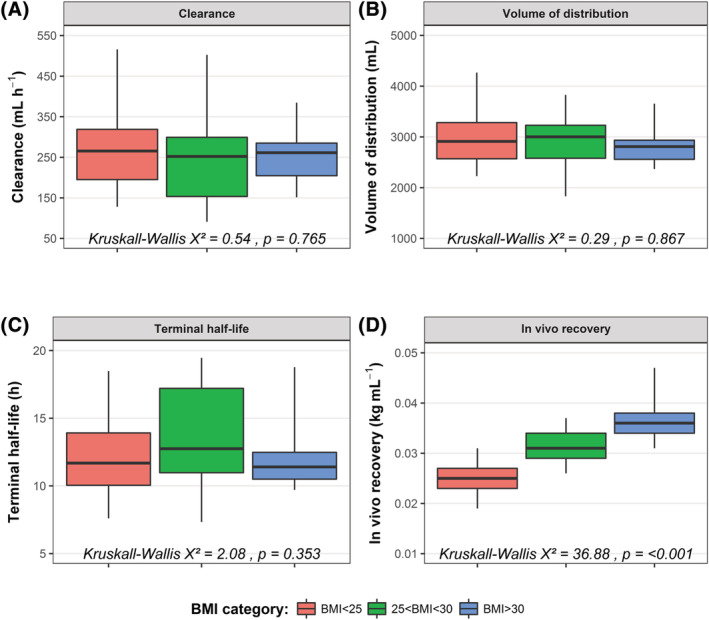
FIGURE 2.

No differences in individual pharmacokinetic (PK) parameters (clearance, volume of distribution and terminal half‐life) between BMI categories. (A) Clearance. (B) volume of distribution of the central compartment. (C) Terminal elimination half‐life. (D) Calculated in vivo recovery. The in vivo recovery was calculated using the body weight of the patient divided by the individual PK parameters estimates for V1. For each boxplot, the whiskers depict the 2.5th and 97.5th percentile of the data, whereas the box depicts the interquartile range. The median of the data is depicted by the black horizontal line inside the boxplot
