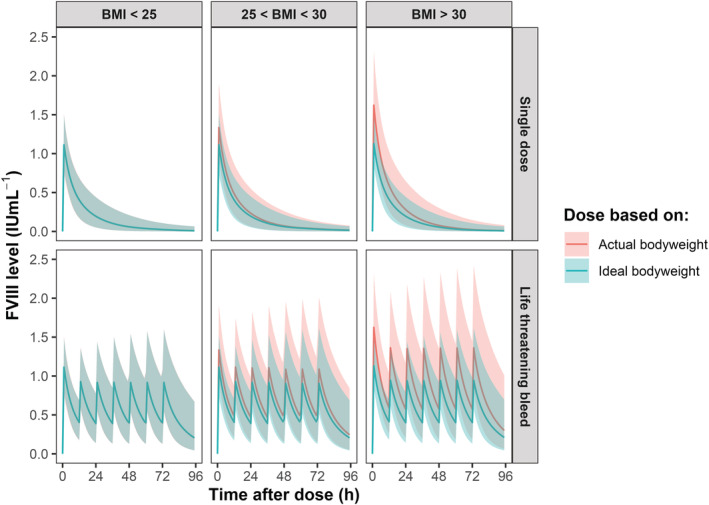
FIGURE 5.

Monte Carlo simulations show adequate coagulation factor VIII (FVIII) levels when dosing is based on ideal body weight. Simulations were performed (n = 1000) using Monte Carlo simulations. The green bold line depicts the median FVIII level when dosing is based on ideal bodyweight and the green shade represents the corresponding 95% confidence interval. The bold red line represents the median FVIII level when dosing is based on actual bodyweight, whereas the red shades represent the 95% confidence interval. Both the upper and lower left panel do not show red lines (dosing based on bodyweight) or shades as they completely overlap with the green lines (dosing based on ideal bodyweight). The lines from the upper plots depict the predicted FVIII levels after a simulated single‐dose of 50 IU kg−1. In the lower panels, a simulated loading‐dose was administered of 50 IU kg−1 followed by twice daily dosing of 25 IU kg−1 to treat a life‐threatening bleed
