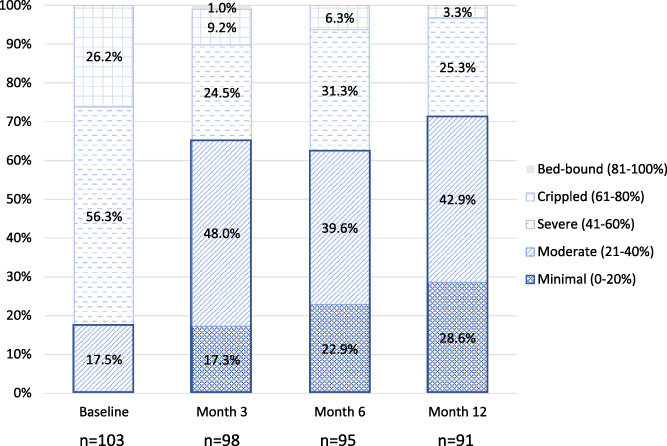
Figure 3.

Longitudinal ODI categories by visit. The change in the percentage of subjects in each of the different ODI categories by visit is displayed. The number of subjects in the minimal and moderate categories increased from baseline through the 12‐month visit. [Color figure can be viewed at wileyonlinelibrary.com]
