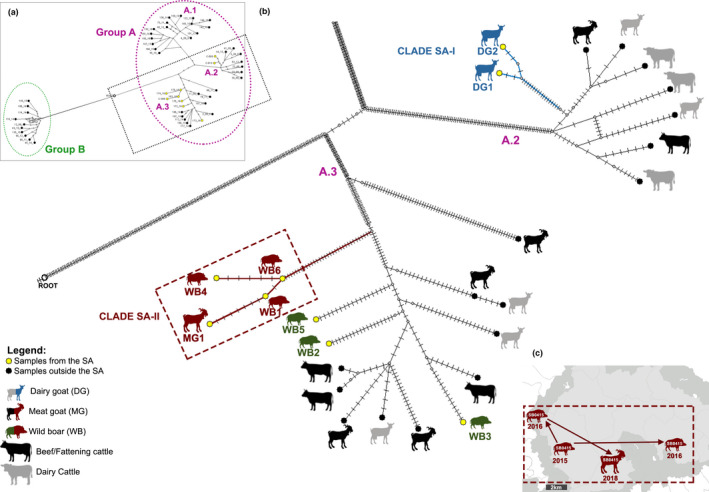
Figure 5.

Evolutionary relationship of Mycobacterium caprae strains based on WGS. (a) Rooted median‐joining network analysis performed with the 52 M. caprae strains isolated in Catalonia between 2008 and 2018 (left‐upper insert). (b) In the zoomed main central image: Yellow circles show the nine strains of the study area (SA), black circles show the 43 strains isolated outside the SA. Root: Mycobacterium bovis AF2122/97 reference strain. Blue silhouettes indicate the dairy goat strains forming the clade SA‐I within the cluster A.2; Red silhouettes indicate the wild boars and meat goat strains forming the clade SA‐II within the cluster A.3; Green silhouettes indicate the remaining wild boars strains of the SA within the cluster A.3. The number of small perpendicular lines in each branch represents the SNPs separating sequences. Potential median vectors (hypothetical genotype) which connect the genome sequences are displayed as little circles in light grey. (c) The map (right‐bottom insert) represents the suggested evolutionary scenario within the clade SA‐II. Silhouettes represent the animal species, the year of M. caprae isolation is indicated below them and arrows indicate the transmission direction [Colour figure can be viewed at wileyonlinelibrary.com]
