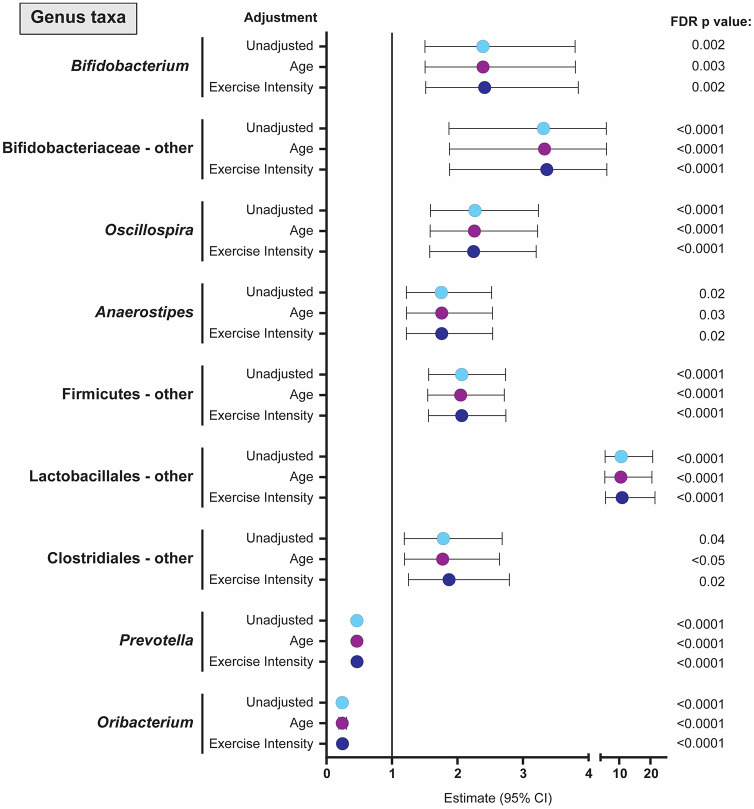
Figure 2.
Forest plot showing the estimate and 95% CIs for all genus level taxa where the exercise intervention had a significant effect on RA. Values are shown for unadjusted analyses (light blue dot) as well as estimates (95% CI) when adjusted for age (green dot) or exercise intensity (purple dot). Estimates above 1 suggest higher RA of genus taxa following exercise intervention with higher levels at older ages when adjusting for age and higher levels in the high-intensity group when adjusting for exercise intensity. Estimates below 1 indicate lower RA with lower levels at higher ages or in the high-intensity exercise group. ‘Other’ refers to all sequences that were classified to the taxa level detailed, but could not be further classified to specific genus. CI, confidence interval; FDR, false discovery rate; RA, relative abundance.

