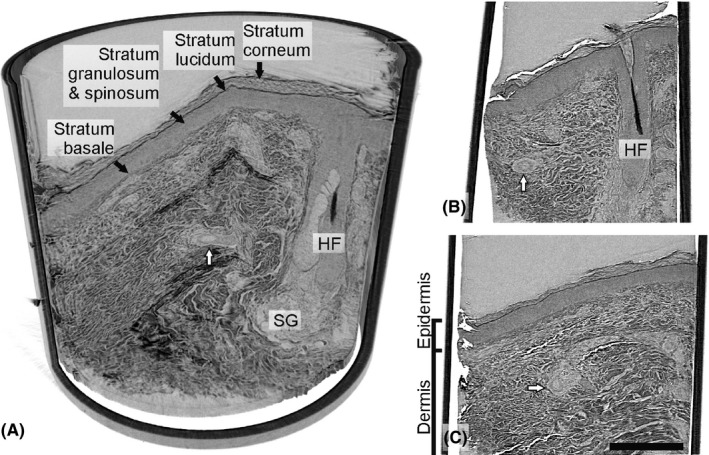
Figure 1.

Laboratory µCT of the sample from the patient with type 1 diabetes. A, Side view of the sample volume rendering in cross‐section, revealing well‐demarcated epidermis, a hair follicle (HF) with part of the hair and blood vessels and an adjacent sebaceous gland (SG). B and C, showing the skin from different depths of the sample. The dermis is predominated by tightly packed dermal fibers (collagenous and elastic) surrounding a HF and arteries (white arrows). Scale bar: 300 µm
