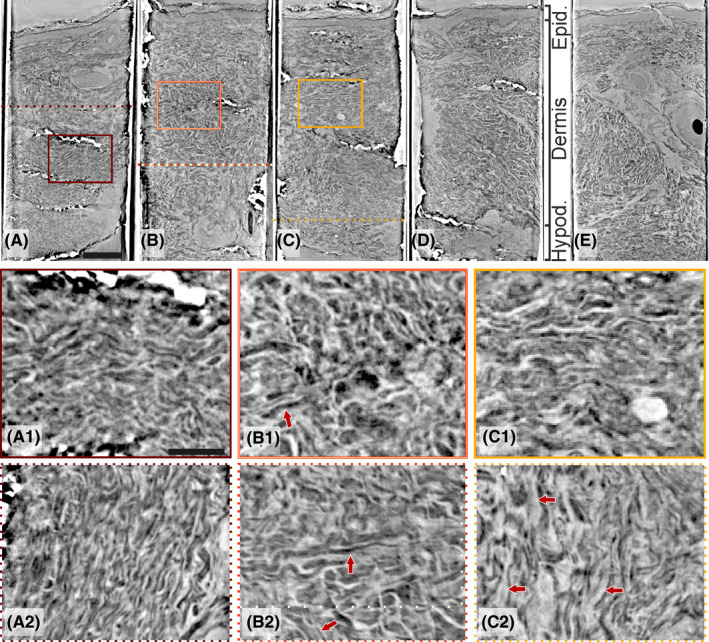
Figure 2.

Panel of the synchrotron data from parallel‐beam configuration. Beneath the panel, zoom‐ins of side‐views (solid squares) and cross‐sections (dotted lines) from figures are shown as indicated: (A) a healthy volunteer with normal intraepidermal nerve fiber density (IENFD) and thin dermal fibers, tightly packed with wave‐like shape (A1 and A2); (B) Ehlers‐Danlos syndrome with enteric dysmotility and decreased IENFD and disorganization of dermal fibers with different orientation (arrows) and slightly increased inter‐fibrillar ground substance (B1 and B2); (C) idiopathic enteric dysmotility with normal IENFD and slightly increased inter‐fibrillar ground substance (C1 and C2); (D) type 1 diabetes with enteric dysmotility and normal IENFD; and (E) drug‐induced chronic intestinal pseudo‐obstruction with decreased IENFD. Scale bars: (A‐E) 300 µm and i and ii) 100 µm [Colour figure can be viewed at wileyonlinelibrary.com]
