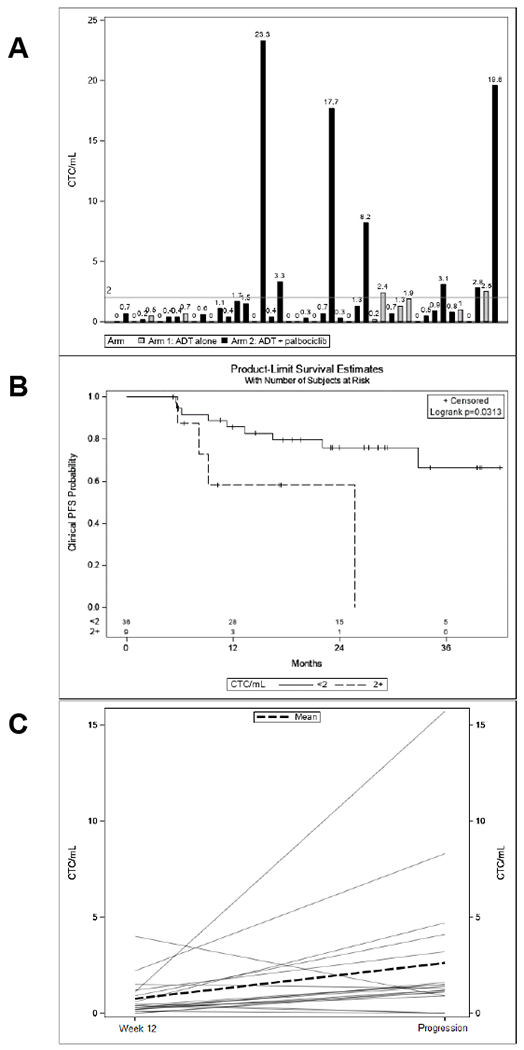
Figure 5.

CTC correlative data. (A) Pretreatment CTC counts by patient and treatment arm. (B) Stratification of patients by pretreatment CTC (≥ 2 or < 2 CTC/mL) demonstrated that pts with higher CTC counts have significantly shorter cPFS. (C) CTC counts increase between week 12 and progression for most patients (N=19).
