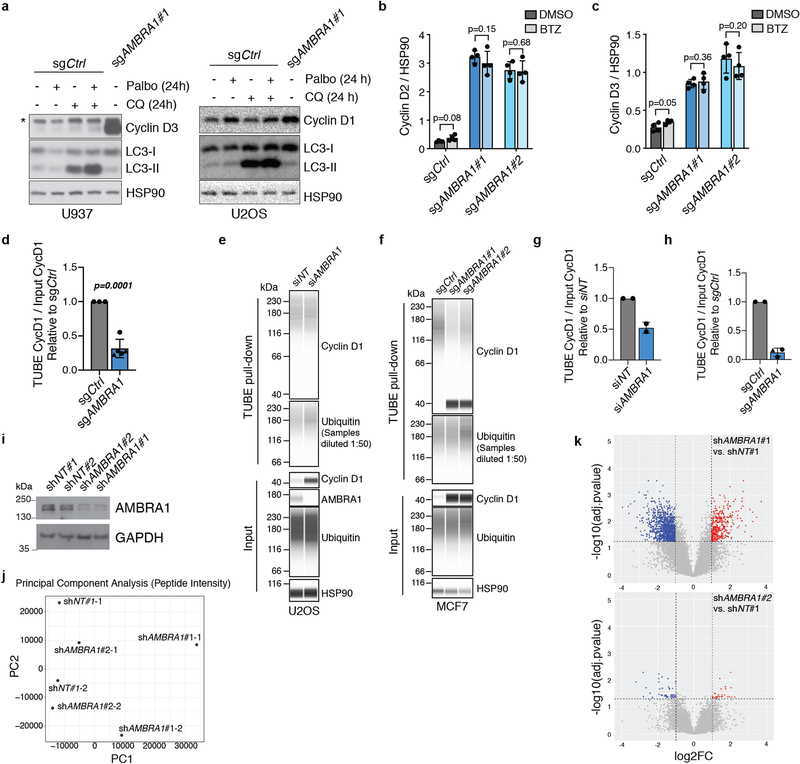
Extended Data Fig. 6 |. AMBRA1 regulates the ubiquitylation of D-type cyclins.
a, Immunoblot analysis of cyclin D3 in wild-type U937 cells (left) or cyclin D1 in wild-type U2OS cells (right) treated with 0.5 μM palbociclib, 25 μM chloroquine or both for 24 h. LC3 and HSP90 blots for U937 cells are the same as in Extended Data Fig. 4c, as the experiments were performed simultaneously. Untreated AMBRA1-knockout cells serve as a control for increased cyclin D expression. Asterisk, unspecific band. n = 3 (U937) or n = 1 (U2OS) biological replicates. b, c, Immunoassay quantification of cyclin D2 (b) and cyclin D3 (c) in U2OS cells treated with 1 μM bortezomib for 4 h (n = 4 biological replicates). d, Quantification of ubiquitylated cyclin D1 relative to total cyclin D1 isolated from U2OS clones pretreated with 1 μM bortezomib for 4 h using TUBEs. Each symbol is an isogenic clone (n = 3 (sgCtrl) or n = 5 (sgAMBRA1)). e, f, Immunoassay of ubiquitylated cyclin D1 isolated using TUBEs following AMBRA1 knockdown in U2OS cells (e) or in populations of control and AMBRA1-knockout MCF7 cells (f). g, h, Quantification of ubiquitylated cyclin D1 relative to total cyclin D1 in AMBRA1-knockdown U2OS cells (g) (n = 2 biological replicates) or AMBRA1-knockout MCF7 cells (h) (n = 2 (sgCtrl) or n = 3 (sgAMBRA1) biological replicates) as shown in e, f, respectively. For all TUBE experiments, only quantification of samples with similar levels of ubiquitin pull down are shown. See Supplementary Table 9 for all data. i, Immunoblot analysis of AMBRA1 in 293T cells expressing control or AMBRA1-targeting shRNAs, pretreated with 10 μM MG132 for 4 h. (n = 1 experiment). j, Principal component analysis of mass spectrometry data from cells in i (two replicates each of shNT no. 1 and shAMBRA1 no. 1 and no. 2) after enriching for ubiquitylated peptides. k, Volcano plot of mass-spectrometry data comparing ubiquitylated peptides in control and AMBRA1 knockdown 293T cells. Each dot is a peptide. Red symbols, significantly upregulated peptides; blue symbols, significantly downregulated peptides, with the indicated cut-offs. All other data are mean ± s.d. P values calculated by two-sided paired t-test (b, c), two-sided unpaired t-test (d) and two-sided unpaired t-test followed by Benjamini–Hochberg correction (k). HSP90 and GAPDH are loading controls.

