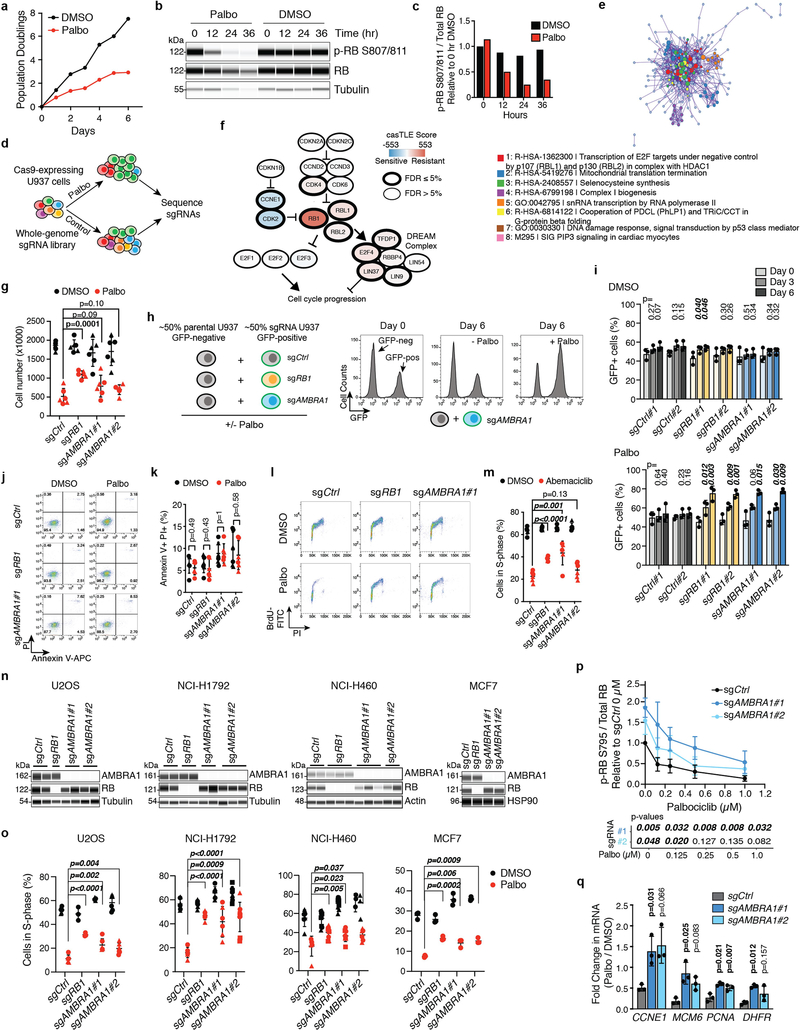
Extended Data Fig. 1 |. Identification of AMBRA1 and other factors involved in the response of cells to CDK4/6 inhibitors.
a, Proliferation of U937 cells in the presence of 0.5 μM palbociclib (palbo) over 6 d, determined by cell counting (n = 1 experiment). b, Immunoassay of total RB and RB phosphorylated at S807 and S811 (p-RB S807/811) in U937 cells over 36 h of palbociclib treatment. c, Quantification of phosphorylated RB relative to total RB from b (n = 1 experiment). d, Schematic of the CRISPR-Cas9 screen in U937 cells. e, Protein–protein interaction map of screen results, generated using Metascape. Coloured nodes represent densely connected gene neighbourhoods. Legend indicates the gene ontology term that is most significantly enriched within each neighbourhood. Node size indicates the degree of connectedness. Gene names can be found in Supplementary Table 3. f, Schematic of the screen results among RB-pathway genes expressed in U937 cells. g, Number of control and knockout U937 cells treated with 0.5 μM palbociclib or DMSO control for 48 h. Each symbol is an isogenic clone (n = 3 biological replicates per clone). h, Left, schematic of the competition assay between GFP-negative parental U937 cells and GFP-positive knockout cell populations. Right, example of flow cytometry analysis for one experiment with AMBRA1-knockout cells. i, Percentage of GFP-positive control or knockout populations in competition assays as in h (n = 3 biological replicates). j, Representative flow cytometry plots of annexin V and propidium iodide (PI) staining in U937 cells treated with 0.5 μM palbociclib for 24 h. k, Percentage of apoptotic (annexinV+PI+) U937 cells after a 24-h palbociclib treatment (n = 3 biological replicates per clone). Palbociclib does not induce apoptosis in any genotype. l, Representative flow cytometry plots of BrdU and PI staining in U937 cells treated with 0.5 μM palbociclib for 24 h. m, Percentage of S-phase cells by BrdU and PI staining in U937 cells treated with 1 μM abemaciclib for 24 h (n = 3 biological replicates per clone). n, Immunoassay for AMBRA1 and RB in control and knockout cancer cell lines generated by CRISPR–Cas9. For U2OS (osteosarcoma), NCI-H1792 (lung adenocarcinoma) and NCI-H460 (large cell lung cancer), each lane is an isogenic clone. MCF7 cells (breast cancer) are populations. o, Percentage of cycling S-phase cells from n after a 24-h treatment with palbociclib (0.5 μM for all cell lines except for MCF7 cells, 0.04 μM). U2OS, NCI-H1792 and NCI-H460 cells were analysed by BrdU and PI staining, and each symbol is an isogenic clone (n = 3 biological replicates per clone). MCF7 cells were analysed by PI staining (n = 3 biological replicates). p, Quantification of RB phosphorylated at S795 (p-RB S795) over total RB in U937 cells treated with increasing doses of palbociclib for 24 h, measured by immunoassay (n = 4 biological replicates). q, Fold-change in mRNA levels of E2F target genes in U937 cells treated with 0.5 μM palbociclib for 24 h, measured by quantitative PCR with reverse transcription (RT–qPCR) (n = 3 biological replicates). All data are mean ± s.d. P values calculated by two-sided unpaired t-test (g, k, m, o) and two-sided paired t-test (i, p, q). Tubulin, HSP90 and actin are loading controls.

