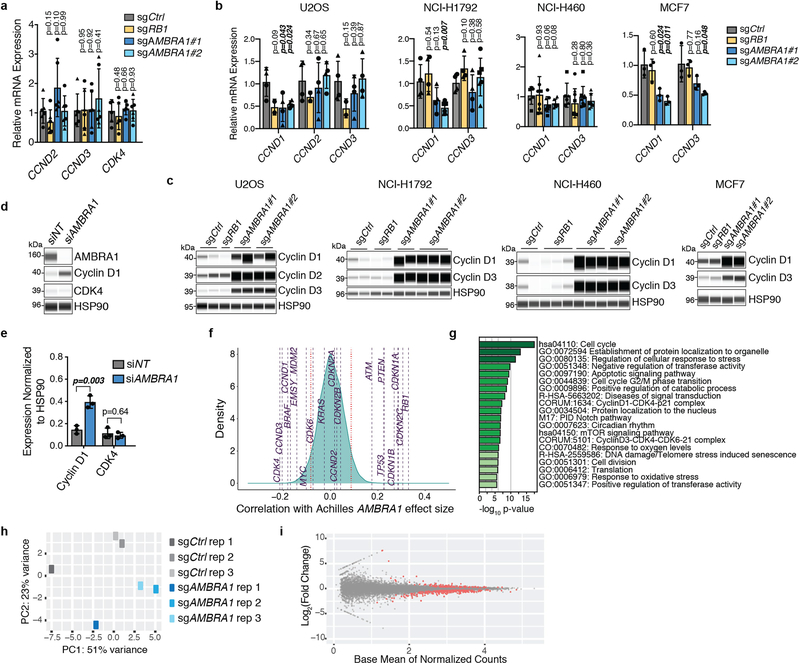
Extended Data Fig. 2 |. AMBRA1 loss regulates cyclin D post-transcriptionally and dependency on AMBRA1 correlates with cyclin D signalling networks.
a, b, RT–qPCR analysis of the genes encoding D-type cyclins (CCND genes) and CDK4 in U937 cells (a) (n = 3 biological replicates per clone) or expressed D-type cyclins in other cancer cell lines (b). For U2OS, NCI-H1792 and NCI-H460 cells, each symbol is an isogenic clone (n = 2 biological replicates per clone). MCF7 cells are populations (n = 3 biological replicates). P values evaluate differences between knockout cells and controls for each gene. c, Immunoassay of D-type cyclins in cancer cell lines in b. d, Immunoassay of AMBRA1, cyclin D1 and CDK4 in U2OS cells after 48 h of AMBRA1 knockdown by siRNA pools. e, Quantification of cyclin D1 and CDK4 protein levels in d (n = 3 biological replicates). f, Correlation of gene dependency scores between AMBRA1, RB pathway genes and additional cancer drivers, according to DepMap. Red lines mark the top and bottom 5% of genes. g, The 20 most significantly enriched gene ontology terms among the top 100 genes, the loss of which best correlate with loss of AMBRA1 in DepMap. h, Principal component (PC) analysis of RNA-sequencing data from U2OS cells, three biological replicates per cell line. i, Volcano plot of RNA-sequencing results comparing control and AMBRA1-knockout U2OS cells. Significantly differentially expressed genes (P < 0.01) are in red. All data shown as mean ± s.d. P values calculated by two-sided unpaired t-test (a, b), two-sided paired t-test (e), hypergeometric test (g) and Wald test (i).

