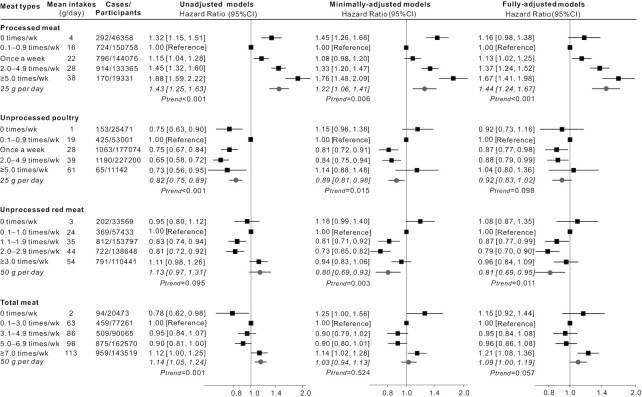
FIGURE 1.
HRs (95% CIs) for the associations between incident all-cause dementia and meat consumption in UK Biobank (n = 493,888). The black squares and horizontal lines represent HRs and 95% CIs respectively in Cox proportional-hazards regressions. The distribution of ticks on the x axis is exponential. Participants were categorized based on the data distribution of baseline meat intakes. Mean daily intakes in each category were calculated from the multiple 24-h dietary assessments which were used to test the linear trend per increment. Minimally adjusted models adjusted for age, gender, ethnicity, education, socioeconomic status. Fully adjusted models additionally adjusted for region, smoking status, physical activity, BMI, sleep duration, stroke history, and family history of dementia, and dietary covariates including vegetables and fruits, total fish, tea and coffee, alcohol drinking, processed meat, unprocessed poultry, and unprocessed red meat were also mutually adjusted for.

