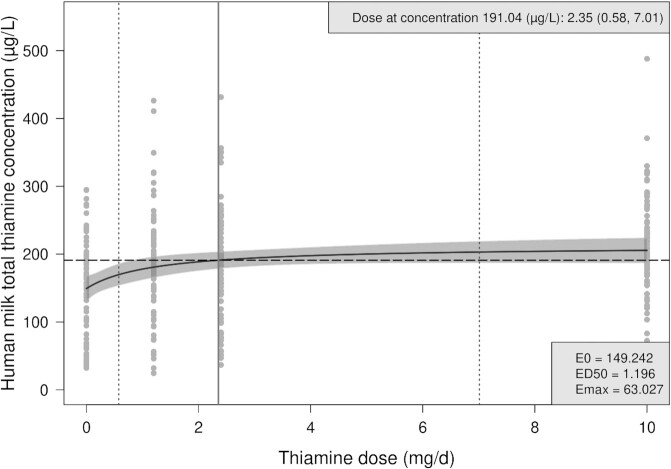
FIGURE 2.
Emax dose–response curve for human milk total thiamine concentration by oral thiamine administration among lactating Cambodian woman at 24 wk postpartum. The solid black line indicates the estimated average human milk total thiamine concentration across doses based on the Emax model [ , with 95% confidence bands shaded in grey. The vertical, solid grey line indicates the estimated dose at 90% of the maximum average human milk total thiamine concentration (i.e., at 191.04 μg/L), with stratified bootstrapped 95% CIs shown in vertical gray dotted lines. Fitted Emax model parameters are shown in the bottom-right box. ED50, dose that produces 50% of the maximum effect of supplementation; Emax, maximum effect of supplementation; E0, baseline concentration without thiamine supplementation.

