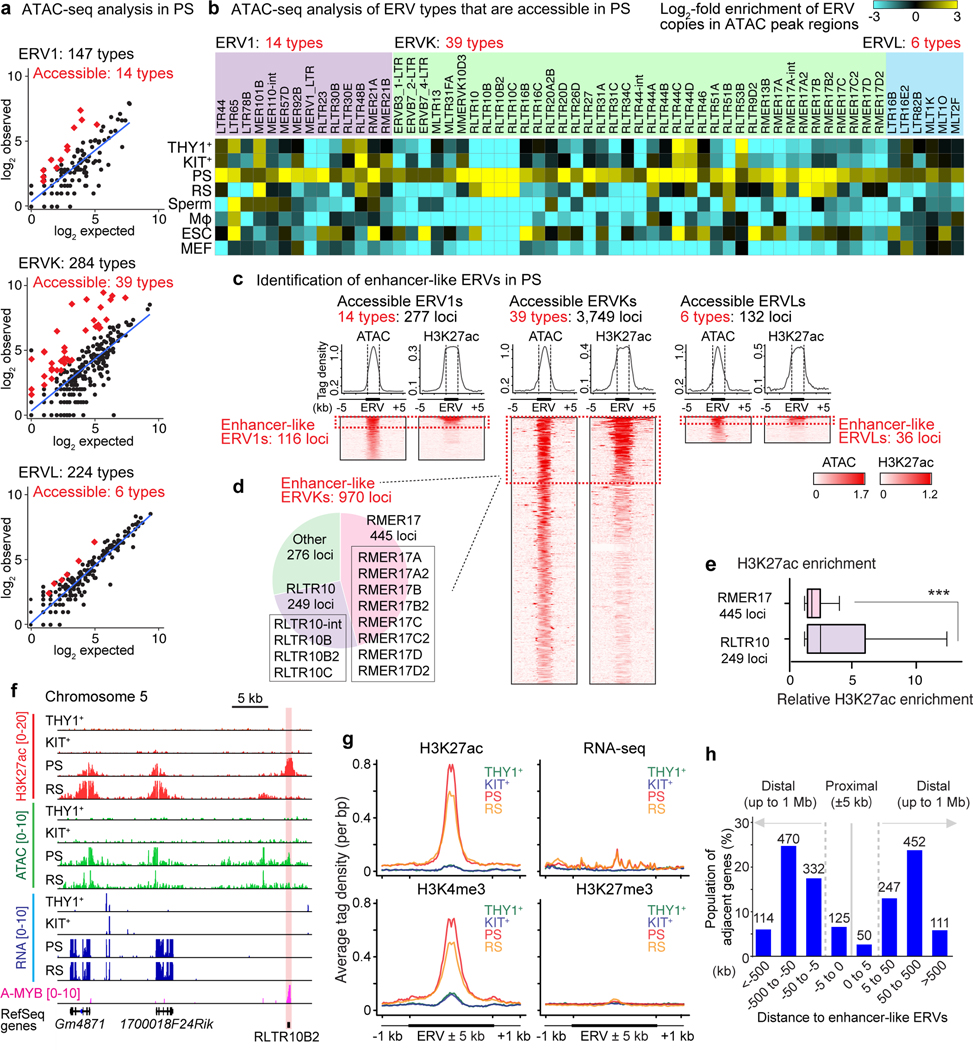
Figure 2. Identification of enhancer-like ERVs in meiosis.
(a) Scatter plots depict observed ERV copy numbers in regions of acessible chromatin (within ATAC peak regions: y-axis) versus the expected prevalence of ERV loci throughout the mouse genome (X-axis) in the following ERV families in PS: ERV1, ERVK, and ERVL. Each dot represents a single type of ERV within a subfamily; red diamonds represent ERV types that exhibit significant enrichment in ERV copy numbers in regions of accessible chromatin (≥2-fold observed/expected enrichment: P < 0.05, binominal test; see Methods). (b) Heatmaps depict log2-fold enrichment of ERV copies in ATAC peak regions relative to genomic prevalence. ERV loci that are accessible in PS are shown. Mφ, macrophages; ESC, embryonic stem cells; MEF, mouse embryonic fibroblasts. (c) Average tag density plots and heatmaps show ATAC and H3K27ac enrichment at accessible ERV regions in PS. We use the term “enhancer-like ERVs” for ERV loci that exhibit both significant ATAC and H3K27ac (n = 1,122 loci : ≥1.5-fold enrichment in comparison to input; see Methods). (d) Pie chart indicates the relative abundances of enhancer-like ERVKs. (e) Relative H3K27ac enrichment at enhancer-like RMER17 and RLTR10 loci in PS. ***P < 0.001, Mann-Whitney U test. Central bars represent medians, the boxes encompass 50% of the data points, and the whiskers indicate 90% of the data points. (f) Track views of an enhancer-like ERV locus. An enhancer-like ERV locus is highlighted. (g) Average tag density plots around enhancer-like ERVs (±1 kb around ±5 kb of ERVs) in representative stages of spermatogenesis. (h) Bar chart depicts the regional distribution of genes adjacent to enhancer-like ERVs; proximal adjacency: ±5 kb; distal adjacency: up to ±1 Mb. Numbers of genes are shown above bars. Data for panels in a, b, e are available as source data.

