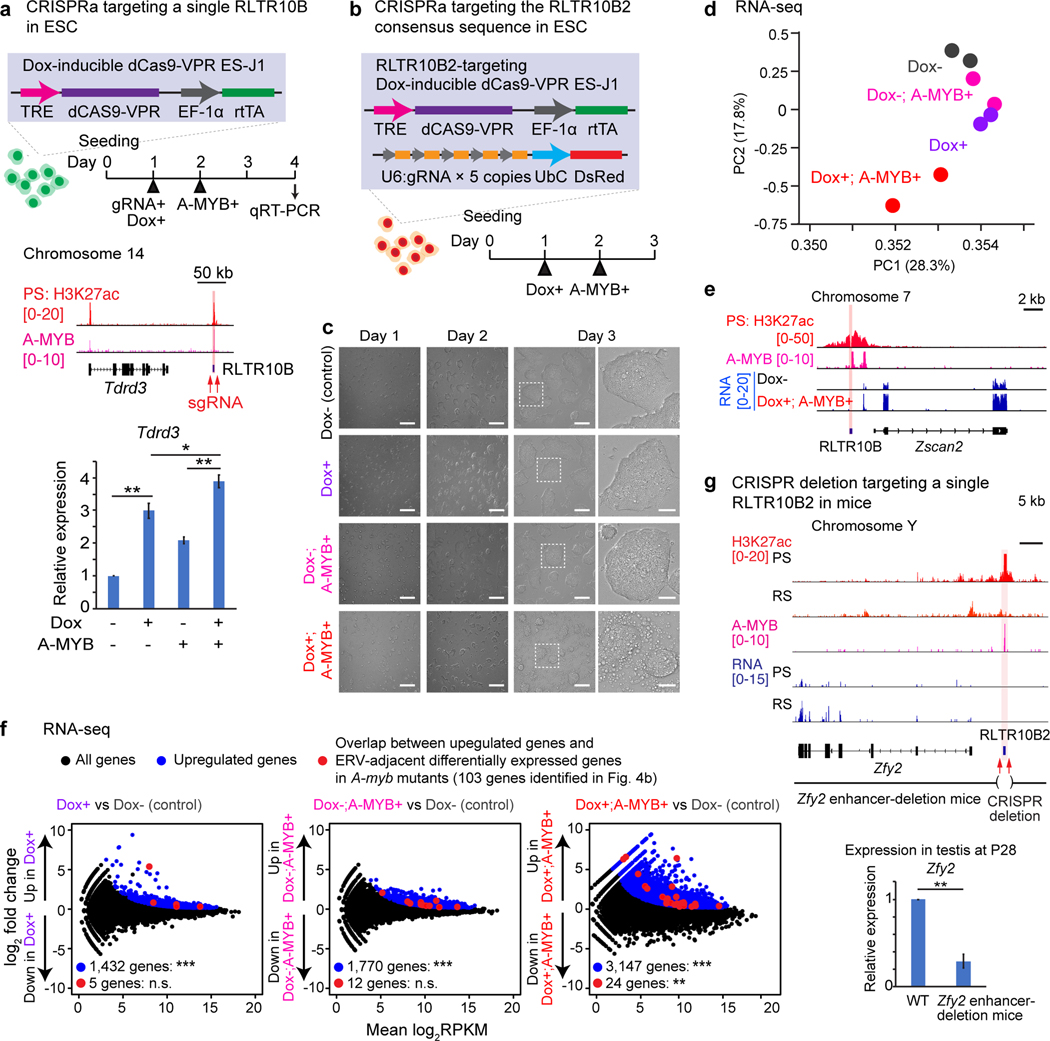
Figure 5. ERV enhancers function to activate adjacent germline genes.
(a) CRISPR activation (CRISPRa) of a single RLTR10B. Top: Schematic for CRISPRa of a single enhancer-like RLTR10B locus (highlighted in red). Bottom: CRISPRa-dependent expression of the gene Tdrd3 in ES cells as measured by qRT-PCR. Error bars represent mean ± s.e.m.: *P < 0.05, **P < 0.01, unpaired t tests.Three biological replicates were examined. (b) Schematic for CRISPRa experiments targeting the RLTR10B2 consensus sequence in ES cells. (c) Phase contrast images of ES cells in which the RLTR10B2 consensus sequence has been targeted via CRISPRa. Scale bars, first three panels left-to-right: 200 μm; right-most panels: 50 μm. (d) Principal component analysis: RNA-seq of ES cells in which the RLTR10B2 consensus sequence has been targeted via CRISPRa. For each condition, two biological replicates were examined. (e) Track view for ES cells in which the RLTR10B2 consensus sequence has been targeted via CRISPRa. An enhancer-like ERV locus is highlighted. (f) RNA-seq analysis of ES cells in which the RLTR10B2 consensus sequence has been targeted via CRISPRa. 1, 432, 1,770, and 3,147 genes evinced significant upregulation in expression (***P adj < 0.01, binomial test with Benjamini-Hochberg correction) in Dox+, Dox-; A-MYB+, and Dox+; A-MYB+ ES cells (blue circles). n.s., not significant, **P = 6.73 × 10⁻³, hypergeometric test. 5, 12, or 24 upregulated ERV-adjacent genes (red circles) ÷ 103 ERV-adjacent differentially expressed genes in A-myb mutants (identified in Fig. 4b); 3,965 upregulated genes (blue circles) ÷ 22,661 NCBI RefSeq genes. (g) CRISPR deletion of a single representative RLTR10B locus in mice. Top: Schematic for the Zfy2 enhancer-deletion mouse model. Bottom: Expression of Zfy2 as measured by qRT-PCR in testes at P28. Four independent Zfy2 enhancer-deletion mice were examined. Error bars represent mean ± s.e.m.: **P < 0.01, unpaired t tests. Data for panels in a, d, f, g are available as source data.

