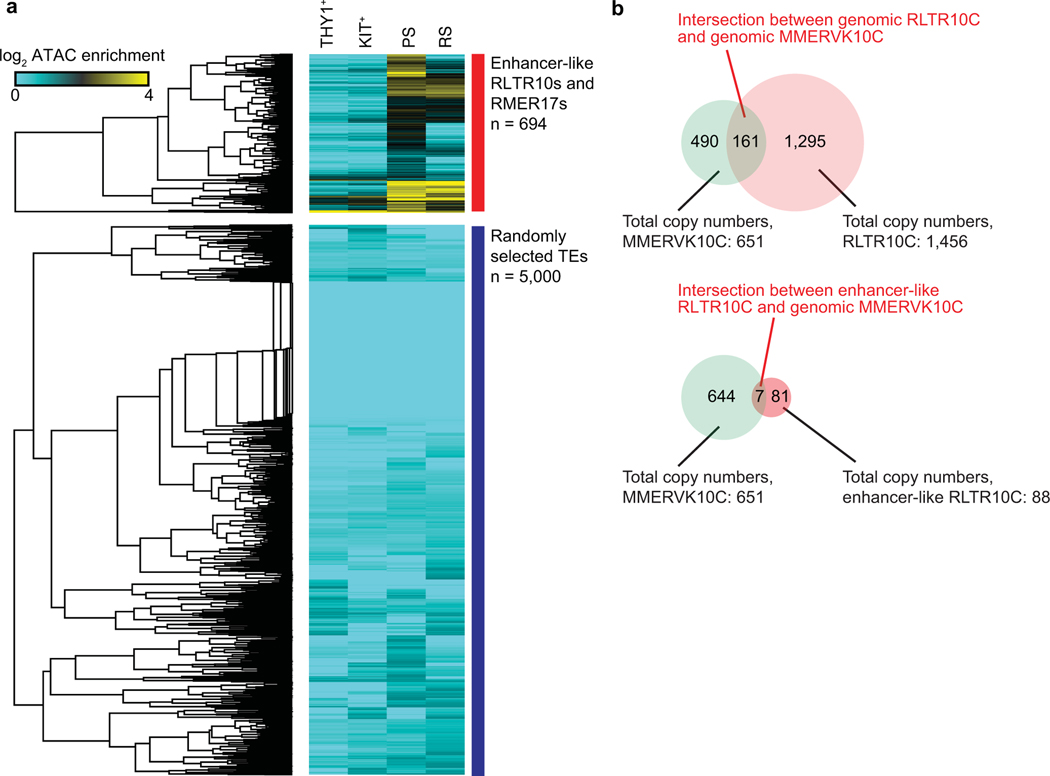
Extended Data Fig. 2. ATAC-seq read enrichment at representative enhancer-like ERV loci and 5,000 randomly selected repetitive element loci.
(a) Heatmap depicts RPKM-normalized ATAC-seq reads at enhancer-like RLTR10 and RMER17 loci (n = 694), and 5,000 randomly selected repetitive element loci in representative stages of spermatogenesis. (b) Top: Venn diagram shows the intersection between total copy numbers of MMERVK10C loci (green) and total copy numbers of all RLTR10C loci (pink). Bottom: Venn diagram shows the intersection between total copy numbers of MMERVK10C loci (green) and total copy numbers of enhancer-like RLTR10C loci (red).

