
Figure 2.
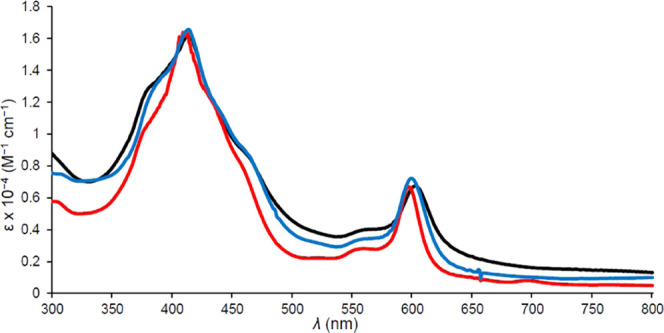
UV–vis comparison of freshly prepared Ir[TpOMePC](dna)2 (black), Ir[TPC](dna)2 (red), and Ir[TpCF3PC](dna)2 (blue) in methanol.
Official websites use .gov
A
.gov website belongs to an official
government organization in the United States.
Secure .gov websites use HTTPS
A lock (
) or https:// means you've safely
connected to the .gov website. Share sensitive
information only on official, secure websites.
UV–vis comparison of freshly prepared Ir[TpOMePC](dna)2 (black), Ir[TPC](dna)2 (red), and Ir[TpCF3PC](dna)2 (blue) in methanol.