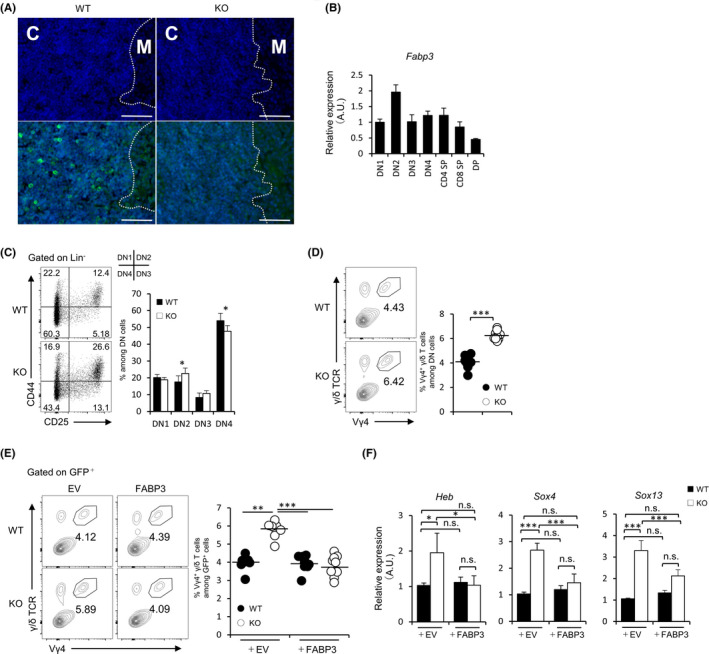
FIGURE 5.

FABP3 regulates differentiation thymic DN2 cells into Vγ4 + γ/δT cells. (A) Immunofluorescence staining of FABP3 (green) and DAPI (blue) in the thymus. C: cortex, M: medulla, Scale bar: 50 μm. (B) Fabp3 mRNA expression of thymic double‐negative cells (DN), CD4 single‐positive thymocyte (CD4 SP), CD8 single‐positive thymocyte (CD8 SP), and double‐positive cell (DP) (C) Frequency (left) and number (right) of thymic DN1 (CD44+CD25−), DN2 (CD44+CD25+), DN3 (CD44−CD25+), and DN4 (CD44−CD25−) cells in juvenile WT and KO mice. (D) Sorted DN2 cells from juvenile WT and KO mice were co‐cultured with OP9/Dll1 cells in the presence of IL‐7 (5 ng/mL) and Flt3 ligand (5 ng/mL). Representative dot plots show the frequency of Vγ4+ γ/δ T cells while graphs indicate the number of Vγ4+ γ/δ T cells. (E) WT and KO DN2 cells were retrovirally transduced with FABP3, and GFP+ DN2 cells were co‐cultured on OP9/Dll1 cells with IL‐7 (5 ng/mL) and Flt3 ligand (5 ng/mL). Representative dot plots show the frequency of GFP+ Vγ4+ γ/δ T cells while graphs indicate the number of GFP+ Vγ4+ γ/δ T cells. (F) Heb, Sox4, and Sox13 mRNA expression of thymic DN2 cells in juvenile mice. Results are normalized to those of Gapdh and are presented relative to those of WT transducing EV. EV: empty vector, *P < .05, ***P < .001 (Student's t test). n.s. not significant. Data are from one experiment representative of three independent experiments with similar results (A‐F) (mean ± SEM of three replicates (B‐F))
