
FIGURE 1.
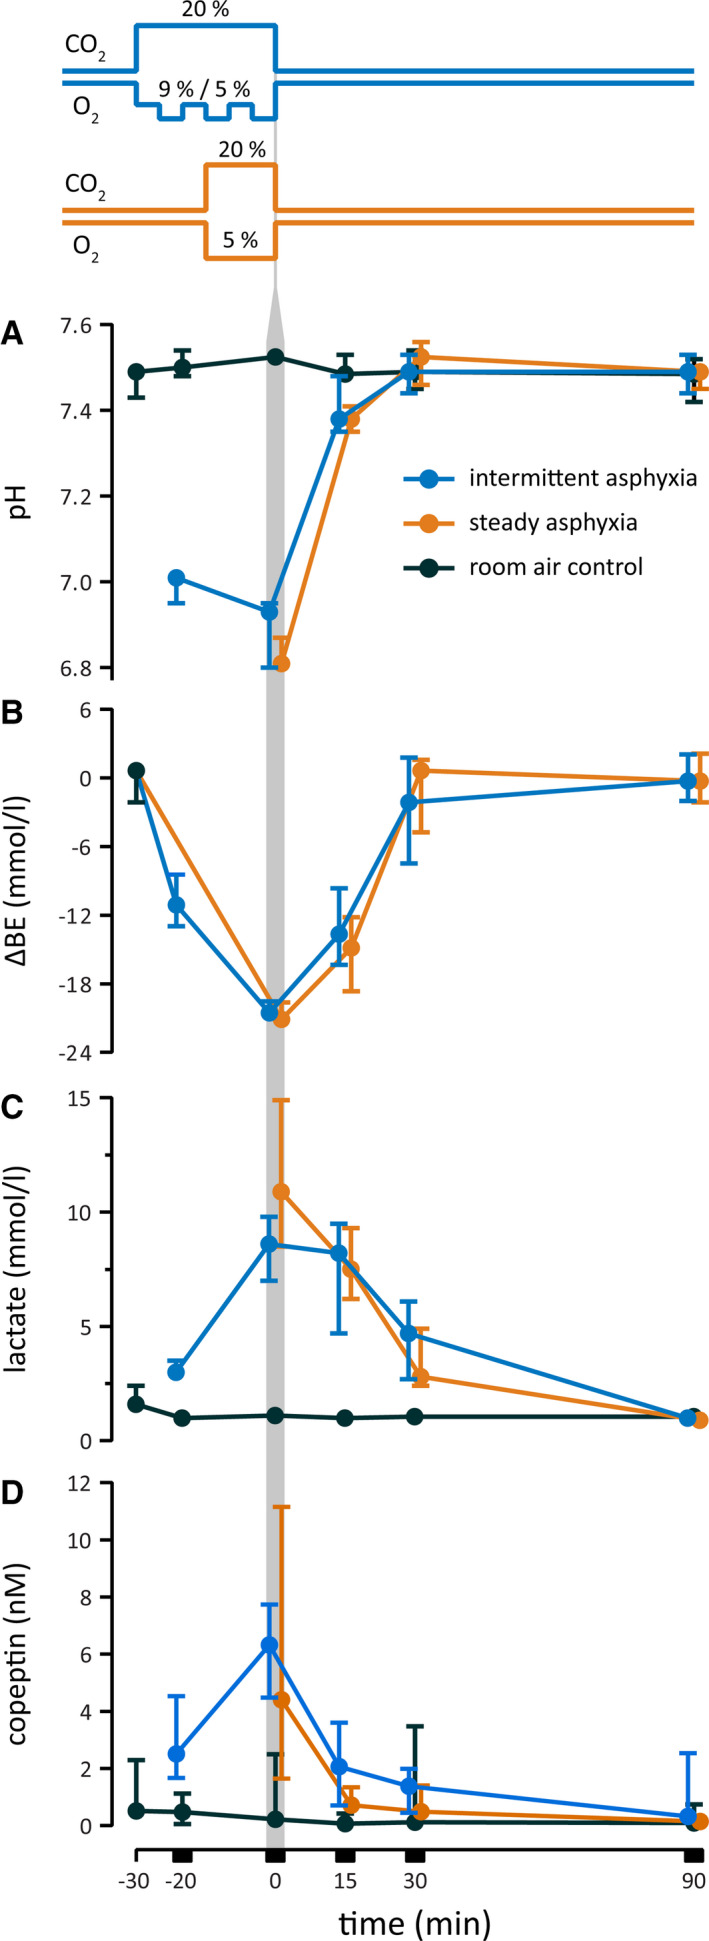
Changes in blood pH (A), base excess (BE; B) lactate (C), and plasma copeptin (D) in postnatal day (P) 11–12 rats exposed to experimental asphyxia. The line graphs on the top illustrate the intermittent (blue) and steady (orange) asphyxia protocols, which start and end in normoxic conditions as indicated by the pre‐ and post‐asphyxia baselines of O2 and CO2. Both protocols decreased pH to <7.0 and BE by 20 mmol·L–1 (ΔBE), and evoked a marked increase in lactate and copeptin. The vertical gray bar marks the end of asphyxia, and, for clarity, the blue symbols have been shifted slightly to the left and the orange symbols slightly to the right. Number of samples per timepoint is 3–5 in the control group and 5–6 in the asphyxia group. The values are median with 95% confidence interval. All data are based on P11–P12 rats in this and subsequent figures