FIGURE 3.

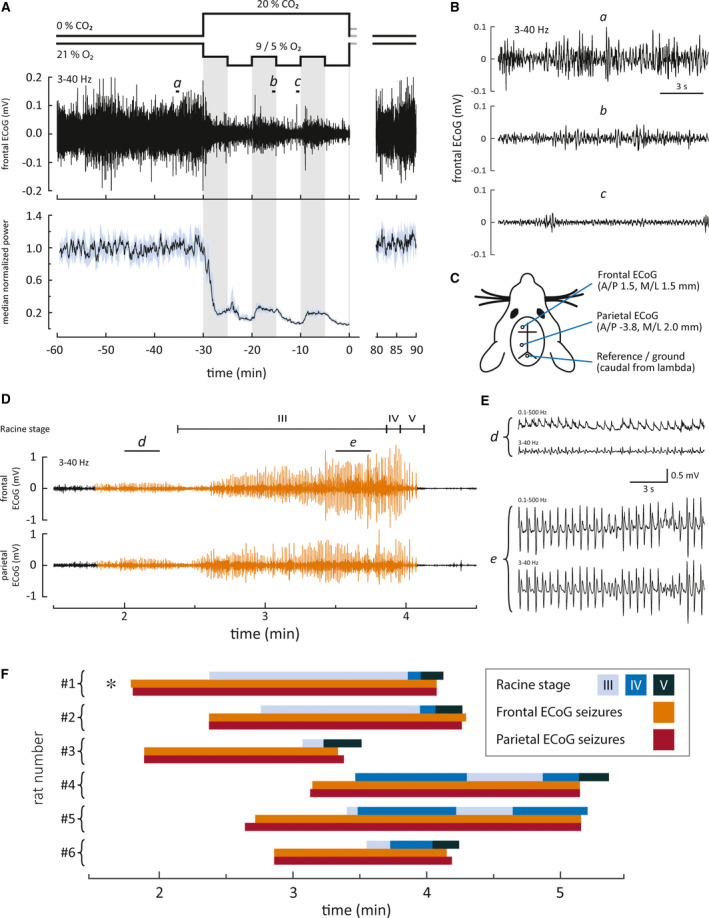
Electrographic and behavioral seizures emerge after but not during intermittent asphyxia. (A) The effect of asphyxia on cortical activity. Top panel features an example of frontal electrocorticography (ECoG) recording and bottom panel displays median power with 95% confidence interval of 18 frontal ECoG recordings. Excerpts a–c marked on the sample ECoG are shown magnified in B. These data demonstrate a profound suppression of cortical activity during asphyxia. (C) Electrode placements (A/P, anterior/posterior; M/L, medial/lateral). (D) An example of a post‐asphyxia recording (asphyxia ends at time 0) showing the temporal relationship between behavioral and electrographic seizures. Panels depict (from top to bottom) Racine stages, frontal ECoG, and parietal ECoG. Electrographic seizures are highlighted in orange. Excerpts d and e from the frontal ECoG displaying early and late stage seizures, respectively, are shown magnified in E. We included two frequency bands in E to show how the seizure activity appears without possible filtering artifacts. (F) Timeline representation of frontal and parietal ECoG seizures and behavioral seizures in the rapid restoration of normocapnia group. Seizures were observed in six of 10 animals. The specimen marked by the asterisk is the same as in D
