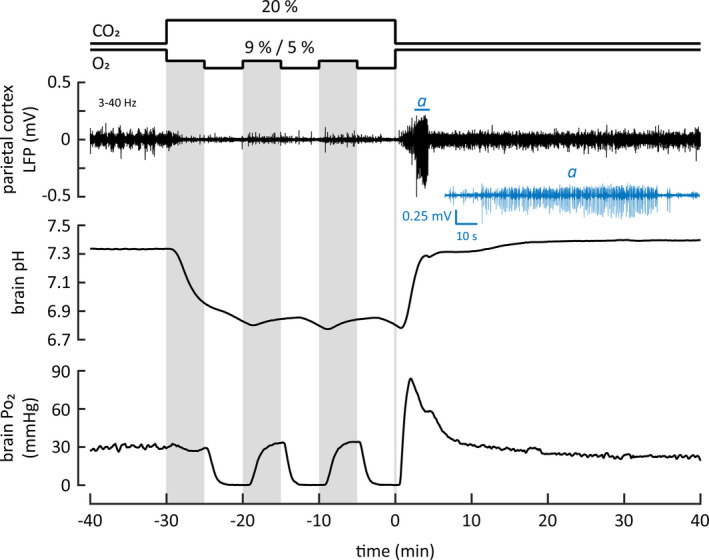
FIGURE 4.

A sample recording with simultaneous monitoring of parietal cortex local field potentials (LFPs), as well as brain pH and Po2. After the intermittent asphyxia, prominent seizure activity was seen in the LFP recording (top panel). Excerpt of the LFP trace (marked with a) including the seizure epoch is shown below in blue. Middle and bottom panels show the pH and Po2 recordings, respectively. To facilitate visual inspection, the three gray vertical columns mark the 9% O2 bouts during the intermittent asphyxia protocol
