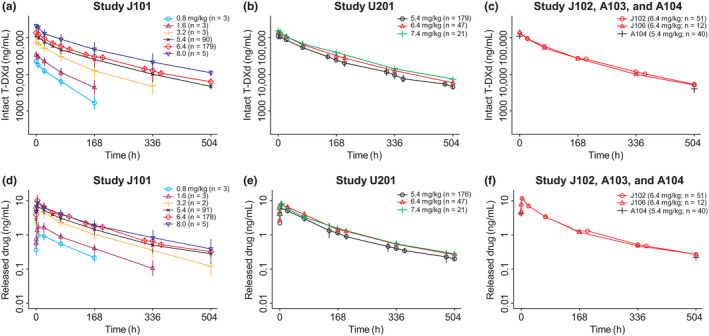
Figure 1.

Observed pharmacokinetic profiles by study and dose following first dose of (a–c) intact T‐DXd (trastuzumab deruxtecan) and (d–f) released drug. Note: Points are geometric mean concentrations at nominal time points after the first dose. Vertical lines are ±1 standard error in the logarithmic domain. The plots show the curves over the first 504 hours. T‐DXd, trastuzumab deruxtecan.
