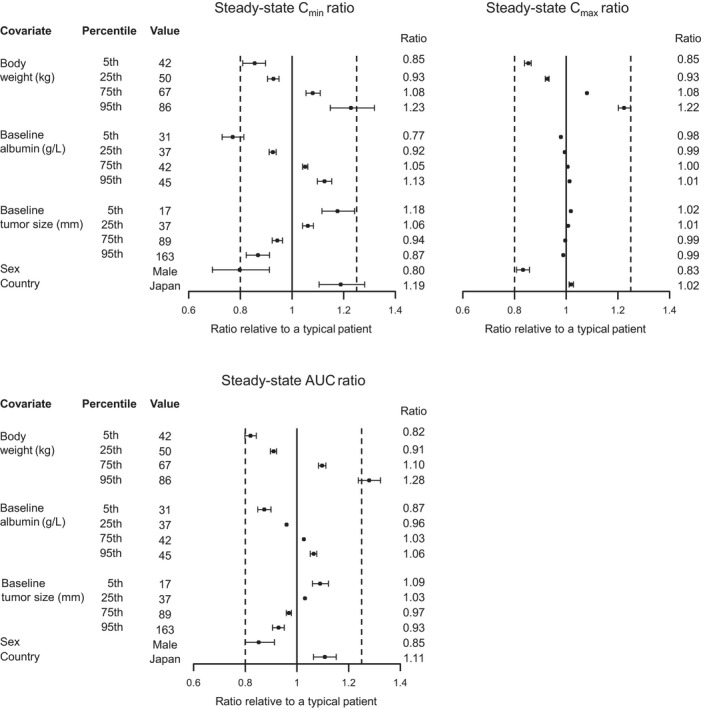
Figure 4.

Forest plot of covariate effects on intact T‐DXd (trastuzumab deruxtecan) exposure. Note: First and second dashed vertical lines correspond to ratios of 0.8 and 1.25, respectively. The solid vertical line corresponds to a ratio of 1 and represents the typical patient. Points and whiskers represent the median and 90% confidence interval, respectively. A typical patient is defined as a female from a non‐Japan country with body weight 57.8 kg, albumin 40 g/L, and baseline tumor size 57 mm. AUC, area under the concentration‐time curve; Cmax, maximum concentration; Cmin, minimum concentration.
